Relationships with Tableau Prep? Now it is possible! (in beta)
For years, Tableau developers have lived in an awkward middle ground.
Tableau developers have done great work only to hear, “That calculation should really be in the data source” or maybe, “Why is this dashboard so slow?”
To which the answer, in frustration, is often, "I would… if I had access to the database.”
After performance recorder sessions, developers often find the workbook is spending half its life recalculating COUNTDs, FIXED LODs, string cleanups, and table calculations over and over again.
That tension has always existed in Tableau.
We want:
- clean reusable logic
- performant dashboards
- flexible filtering
- natural-grain data
- reusable semantic models
But historically, we had to compromise somewhere. And then Tableau Prep came along in 2018 and helped us out in a big way.
The Missing Piece of Tableau Prep
Tableau Prep has always been powerful for:
- cleaning messy data
- standardizing dimensions
- building row-level calculations
- creating aggregate tables
- scaffolding datasets
- generating reusable metrics
The problem was never Prep itself. The problem was what happened after Prep.
Prep could publish data sources into Tableau Cloud or Server… but those published data sources were effectively dead ends.
Relationships came along in 2020, making true data modeling available in Tableau. However, we haven't been able to extend Prep models using relationships, because it wasn't possible to create relationships between published data sources. (If you set your Prep outputs to database tables instead of published data sources, you could create relationships between those tables. However, I expect that most people who had that level of database access weren't using Prep.)
So if you pushed logic into Prep, you often lost the flexibility that modern Tableau data modeling provides.
That created a tradeoff:
- push calculations down for performance
- or keep them in the workbook for flexibility
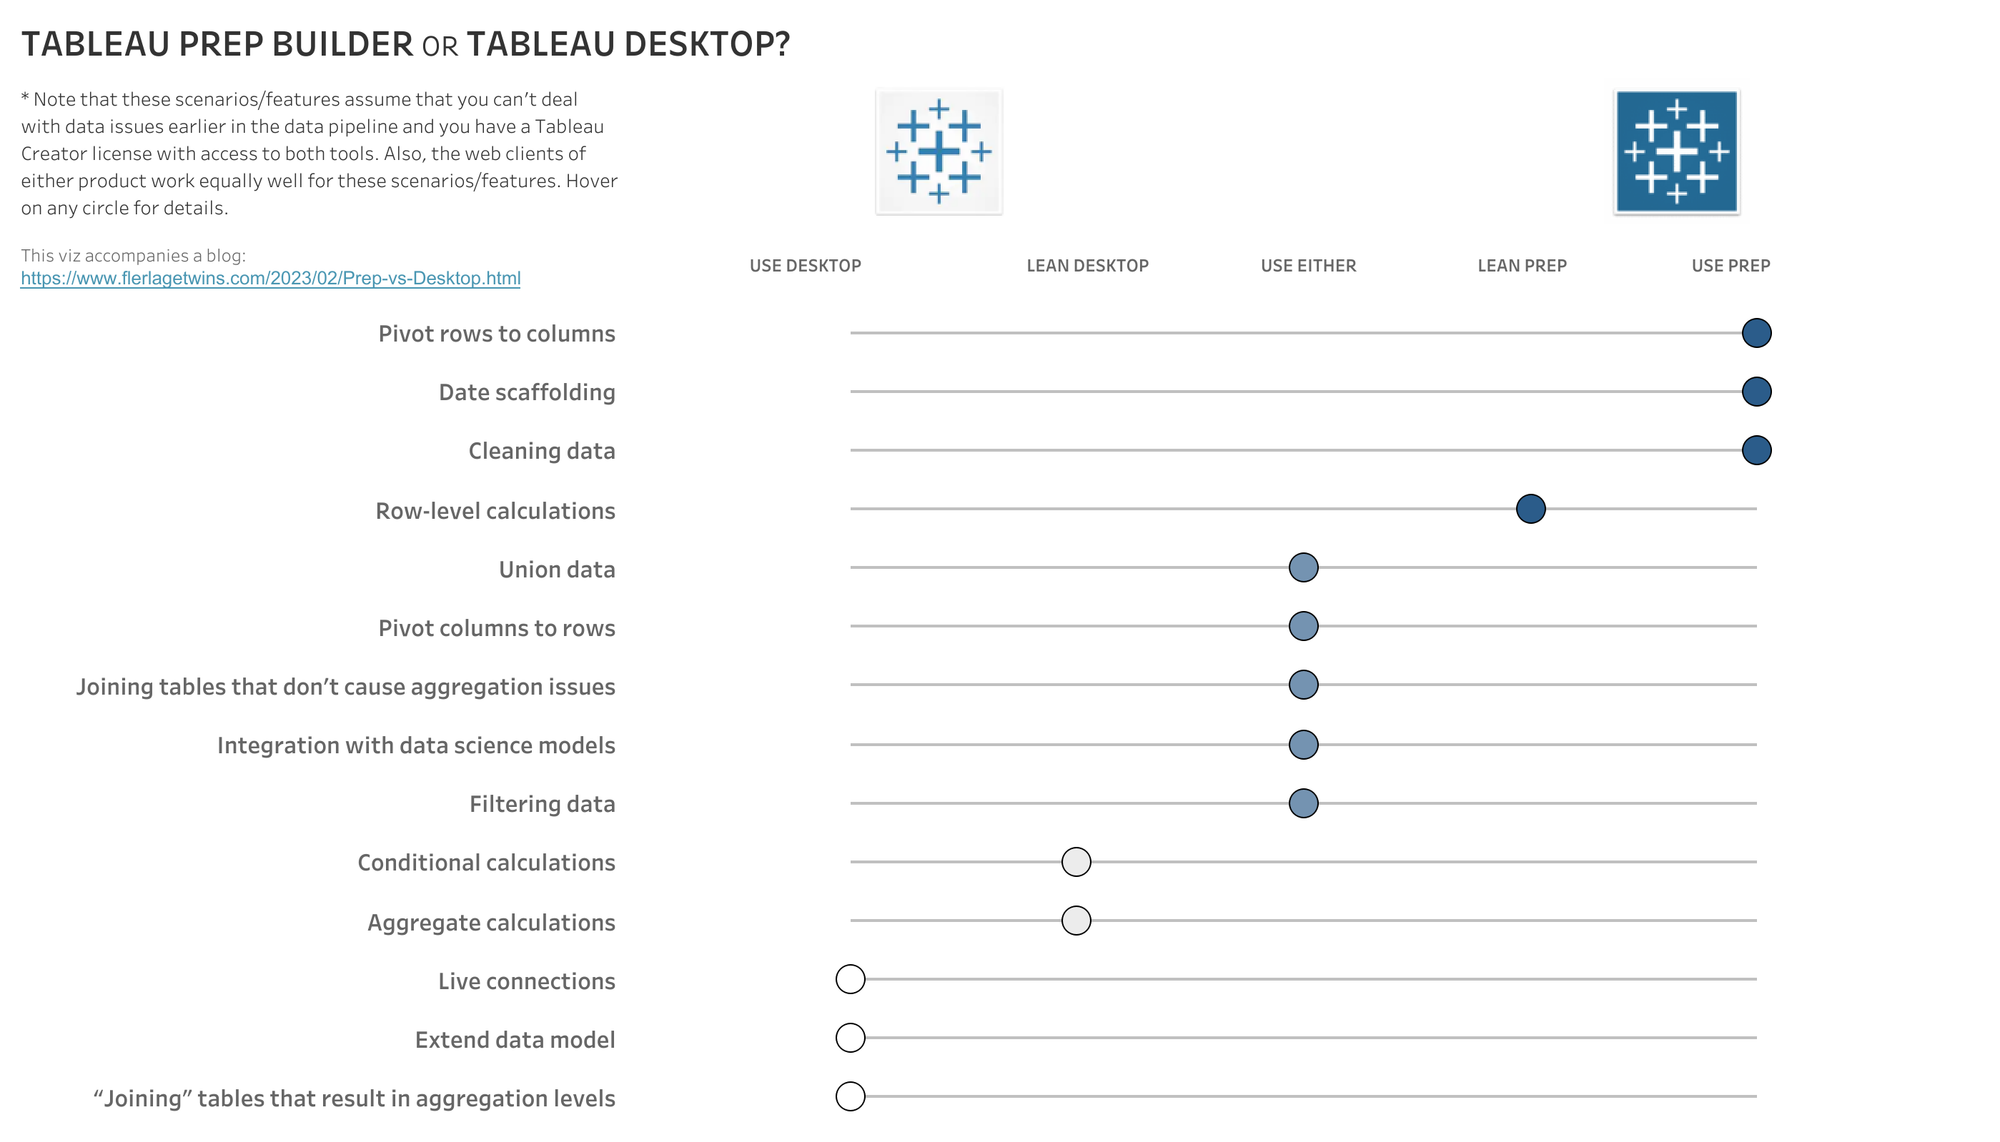
This is a trade-off I previously wrote about on The Flerlage Twins blog in 2023.
Now, composable data sources change that. The trade-offs mostly disappear. I think this is a much bigger deal than most people realize.
Why This Matters
A lot of Tableau performance problems are really modeling problems.
We ask Tableau to do expensive work repeatedly at runtime:
- string calculations
- FIXED LODs
- COUNTDs
- ranking logic
- table calc gymnastics
Every interaction becomes another query cost.
As Candi Munroe and I discussed in our TC26 presentation on this topic, Tableau does not generally materialize calculations in workbooks or published data sources. Those calculations are frequently re-executed as users interact with dashboards.
That means:
- slower dashboards
- more warehouse compute
- harder-to-maintain workbooks
- logic duplicated everywhere
The natural answer has always been to push the logic down. But if pushing logic down forced you into giant flattened joins, you lost many of the benefits relationships introduced in the first place.
Relationships Changed Tableau Modeling
Relationships solved several massive problems:
- keeping data at its natural grain
- avoiding exploding joins
- reducing duplication
- simplifying multi-fact analysis
- improving filtering behavior
- enabling “less data, more answers”
But there was still a gap. Prep outputs and relationship-based semantic modeling were living in separate worlds.
Composable data sources finally bridge that gap.
So What Are Composable Data Sources and How Do They Enable Relationships with Prep?
In simple terms:
You can now relate published data sources to other published data sources.
Among many other use cases, it means Prep-generated outputs can become reusable building blocks inside larger semantic models.
You can now:
- create reusable aggregate tables in Prep
- publish reusable cleaned dimensions
- build certified metric layers
- relate them together later
- extend published data sources without rebuilding everything
This effectively turns Tableau into a much more modular semantic modeling platform.
The New Opportunity
The real breakthrough here is not just “Prep supports relationships.” The breakthrough is that we can finally separate modeling responsibilities properly.
For example:
In Tableau Prep
- string cleanup
- row-level calculations
- reusable FIXED-style logic
- aggregate tables
- ranking and other compute-intensive, table-scan calculations
- data quality work
In the Workbook
Keep:
- interactive aggregations
- flexible filtering
- lightweight calculations
- visualization logic
- table calculations where they actually make sense
That’s a far cleaner architecture and one that scales organizationally.
A Practical Example
Let's look at the same fictional call center example we used in the TC26 presentation.
Executives are looking for:
- employee ranking by manager by month
- time since employee took their first call
- drill-through to detailed calls
Let's look at the transactional table that captures calls:
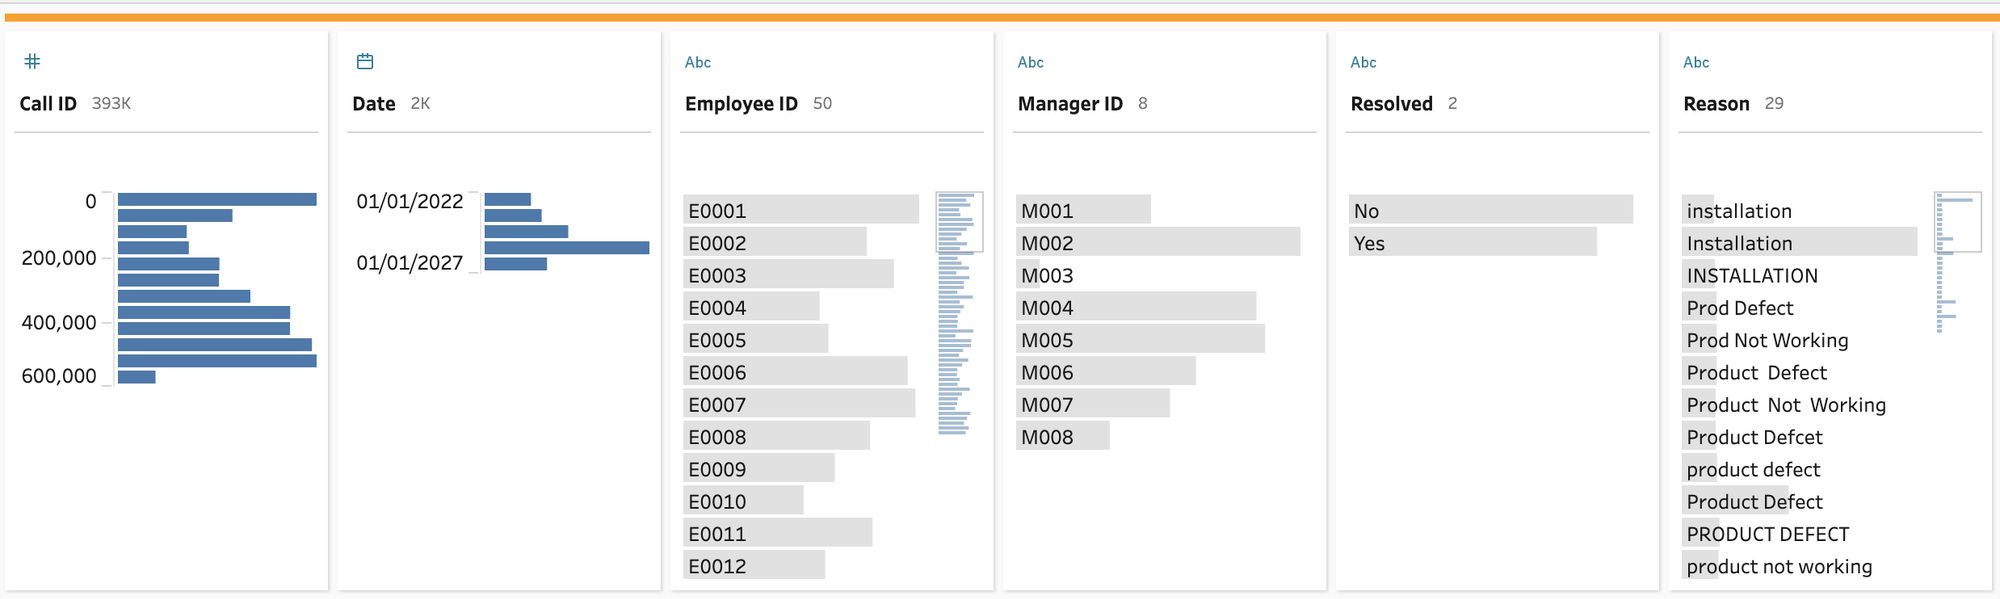
This is a simple table, but it shows the basis of what a lot of these tables could look like. (A "real" table might not be one row per call but have status updates - Prep could help solve that "grain" issue too. For now, we will focus on this more simple, near real-world example to make the case.)
Right away, we can see some of the problems with bringing a table like this into Tableau Desktop (or as a published data source):
- a messy text field
- the need for relationships with employee and manager dimension tables (or blow up this table by joining in those string fields)
- Resolved being neither binary (for math) nor a true boolean (yes/no not true/false)
- the need for a multi-pass query (or in Tableau's case, a nasty table calc) to get the rank by employee by manager by month to work
- the need for an LOD to get the first date an employee took a call
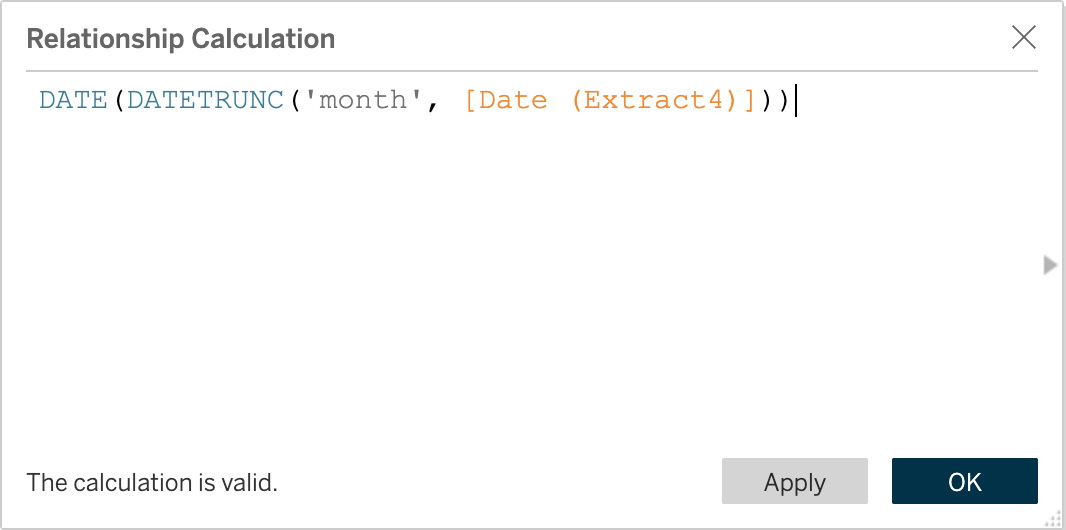
How can we solve these with Prep? First, let's get the first date each employee took their first call (this assumes the table goes back to the beginning of calls, of course):
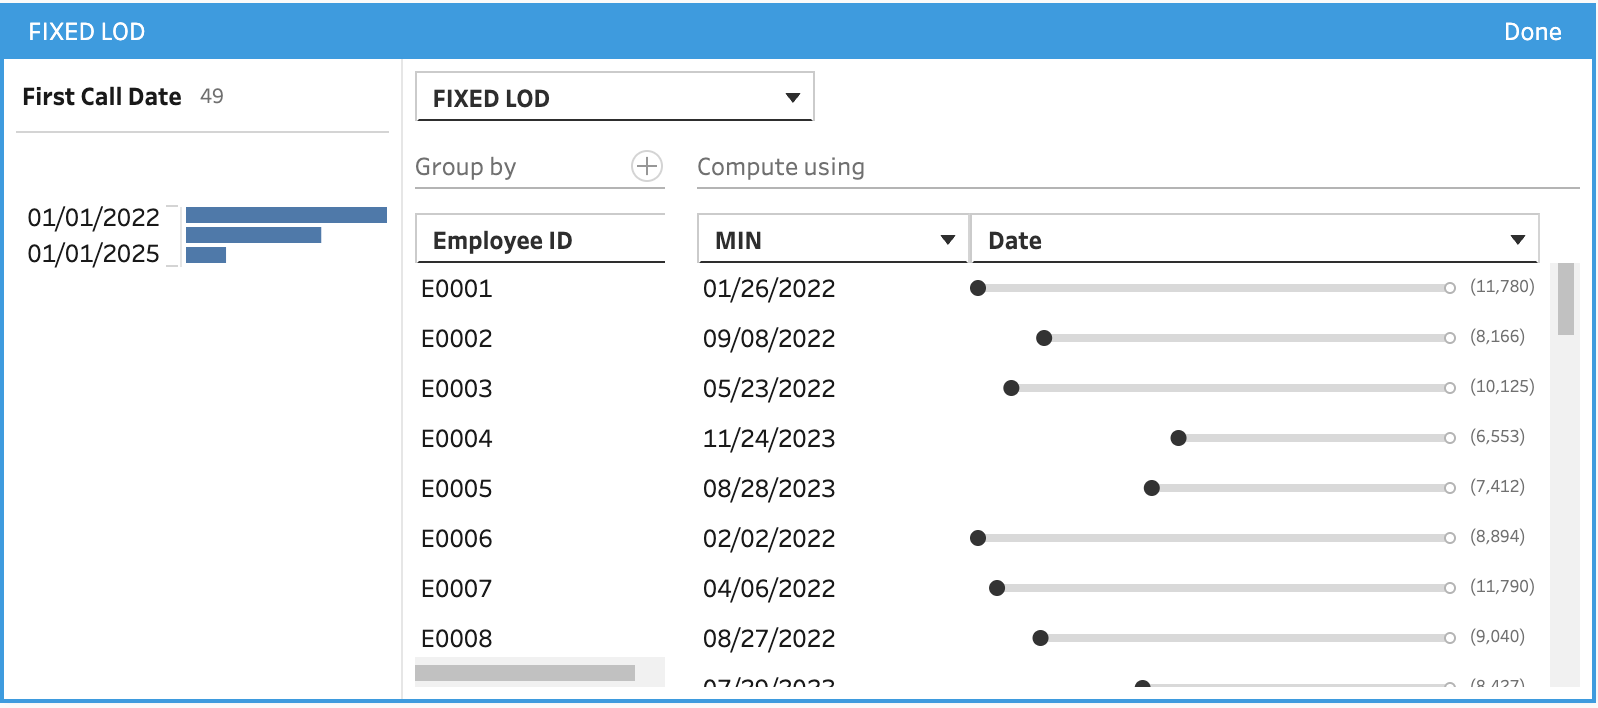
This calculation interface is so good! You can see the impact of the calculation visually, without needing to type anything.
This is the equivalent of { FIXED [Employee ID] : MIN([Date]) } in Tableau Desktop/published data source. In Prep, it is both faster as the calculation will now be materialized as a column that doesn't need to be recalculated unnecessarily on each sheet and easier to write!
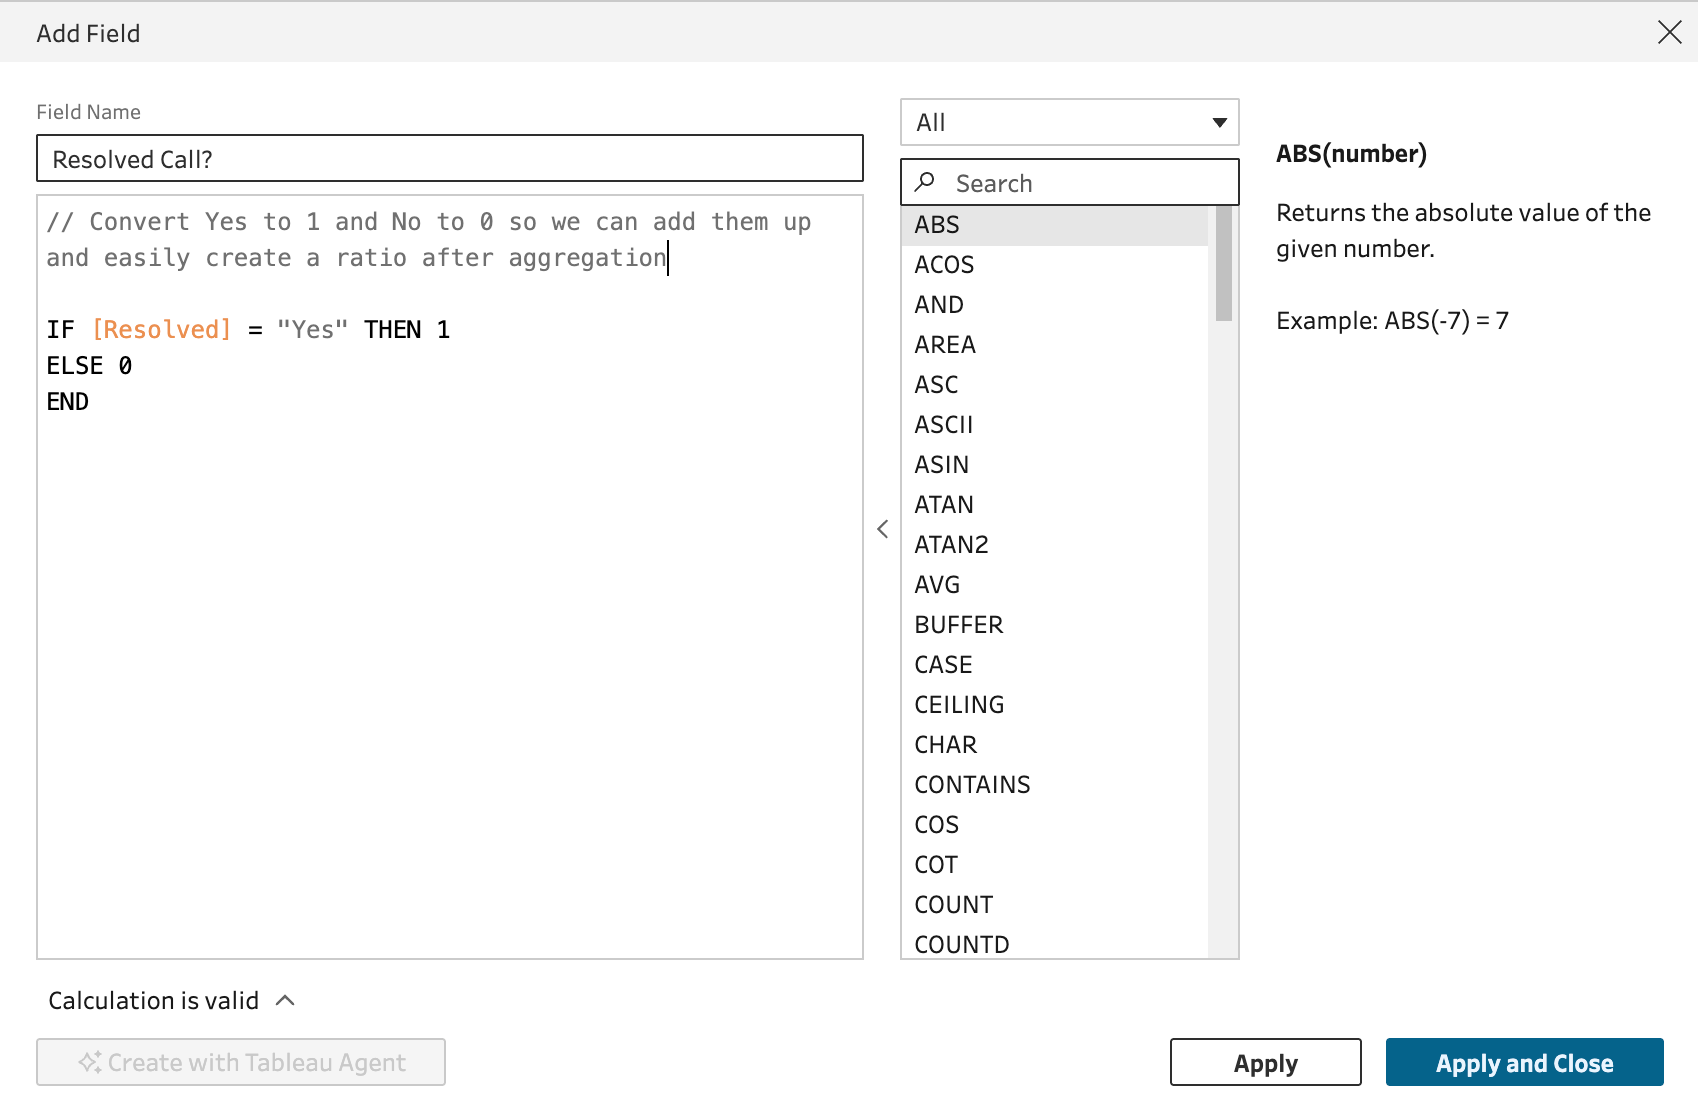
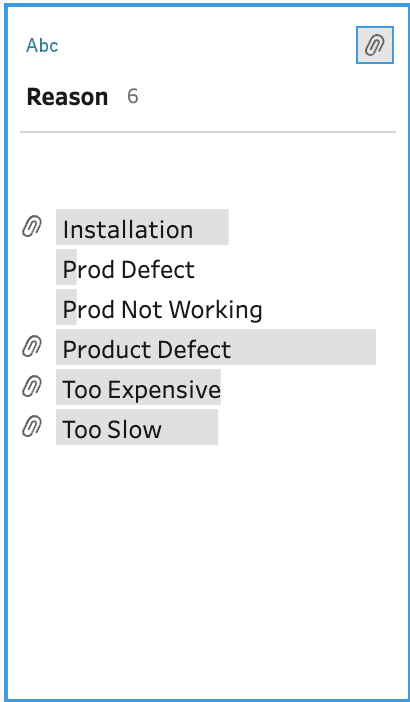
Next up we have to clean up that Resolved Calls field to make it easier to do math on it:
Let's clean up the messy text field in two steps. First, using the machine learning algorithm on Group --> Pronunciation:
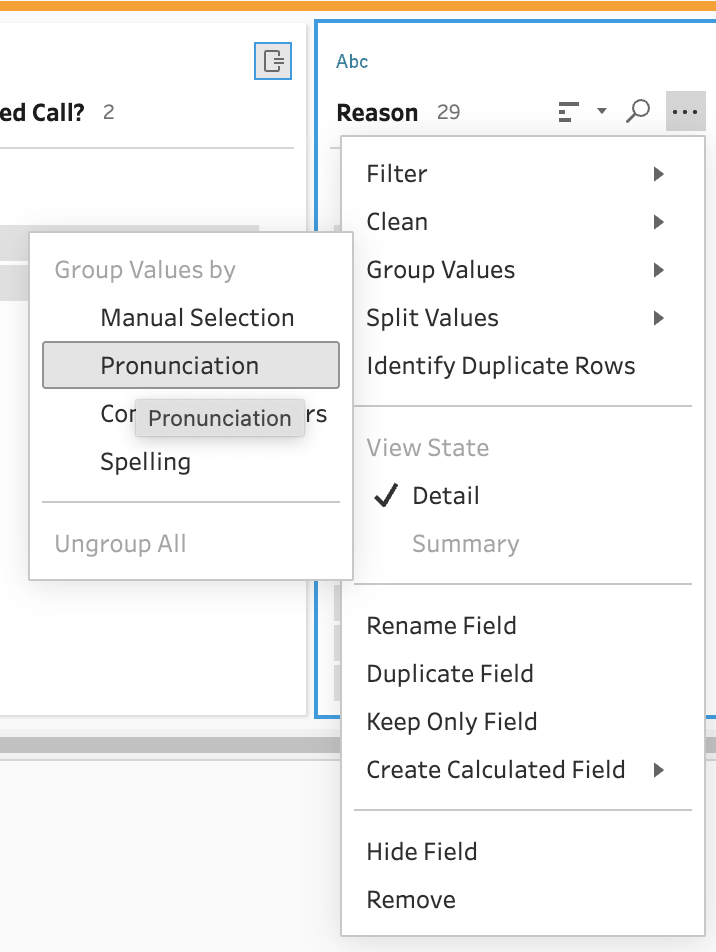
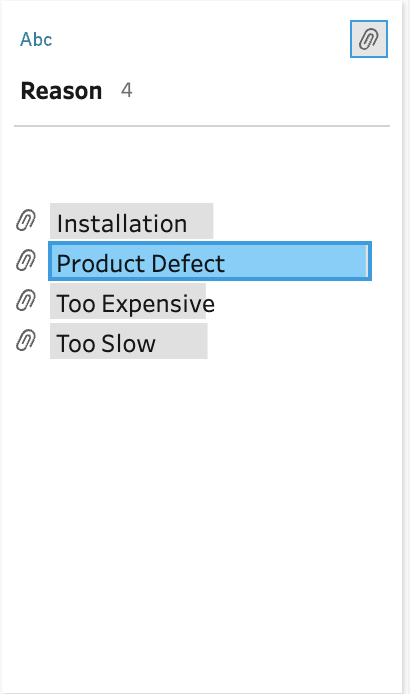
Then we can manually group "Prod Defect" and "Prod Not Working" into a single field by manually typing "Product Defect" over each:
We now have a great new fact table (a detailed table of measures with keys for dimension tables) that we can use in Tableau without needing to do the LOD, text cleanup, and boolean-to-binary calculations in Tableau. If we think about these calculations, they all happen at the row level. That means they cannot be filtered "lower" than this level and therefore make sense to be calculated "before" bringing them into a workbook.
Let's close this step by creating an output to a published data source on the same Tableau Cloud site:
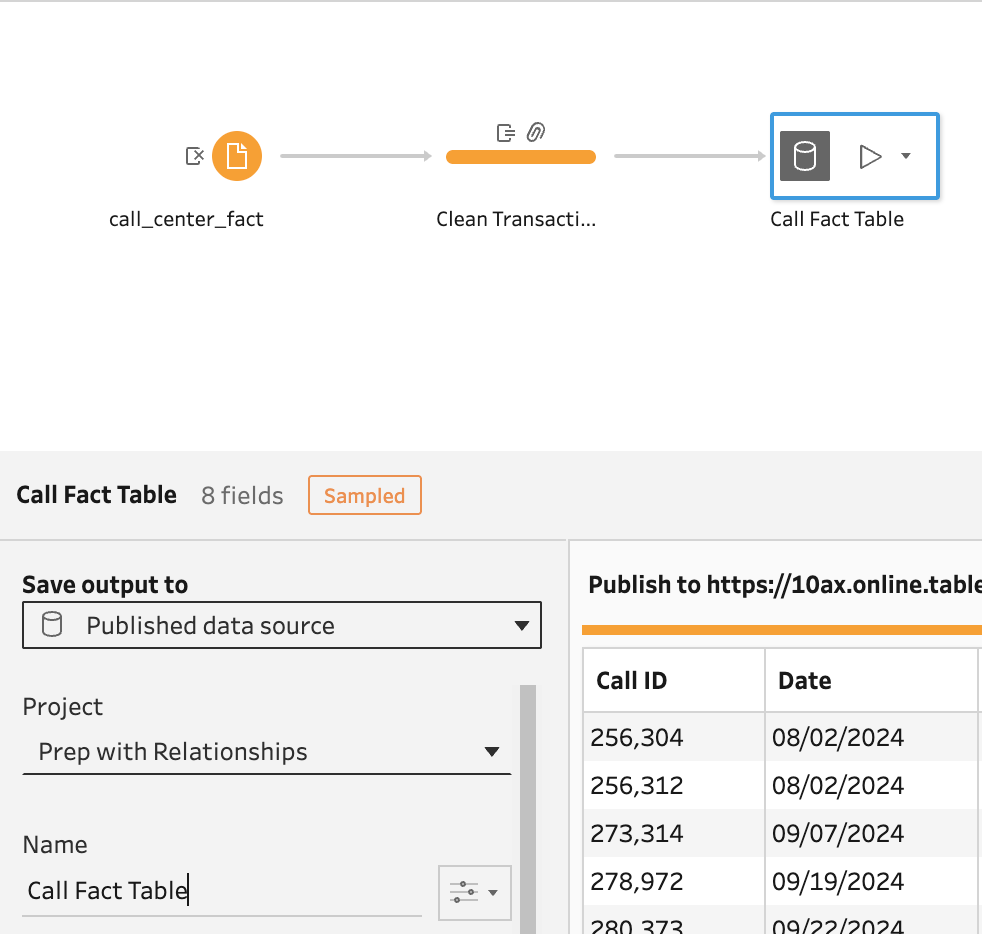
So far, we have addressed a lot of our data cleanup and work that is going to help with dashboard performance.
However, trying to get the bump chart of rank of employee by manager by month for resolution rate would be very complicated in Tableau. And frankly, if this had real-world levels of detail, it just won't work. It would first be slow, then it would either error out, finally "locking up" your browser. The reason is that RANK is a table calculation and for a table calculation to work at this level, Tableau would have to bring in a lot of data to the browser memory... again, in this case, too much data.
A similar use case was created as a Workout Wednesday challenge by Lorna Brown last year. It is not the exact same but shows the complexity to do this with table calculations, even assuming the amount of data we had would work.
Prep makes this so much easier! First, we are going to create a fork from our flow and create an aggregate table. This allows for the pre-calculations of complex aggregations:
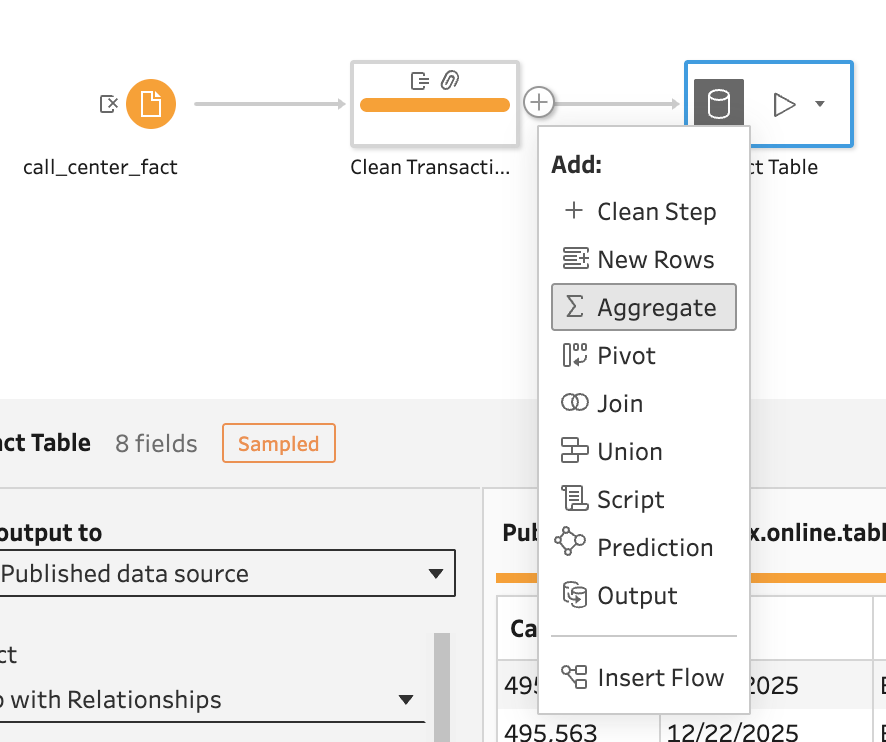
Aggregations are easy from this point. It's all drag-and-drop and reads like a sentence:
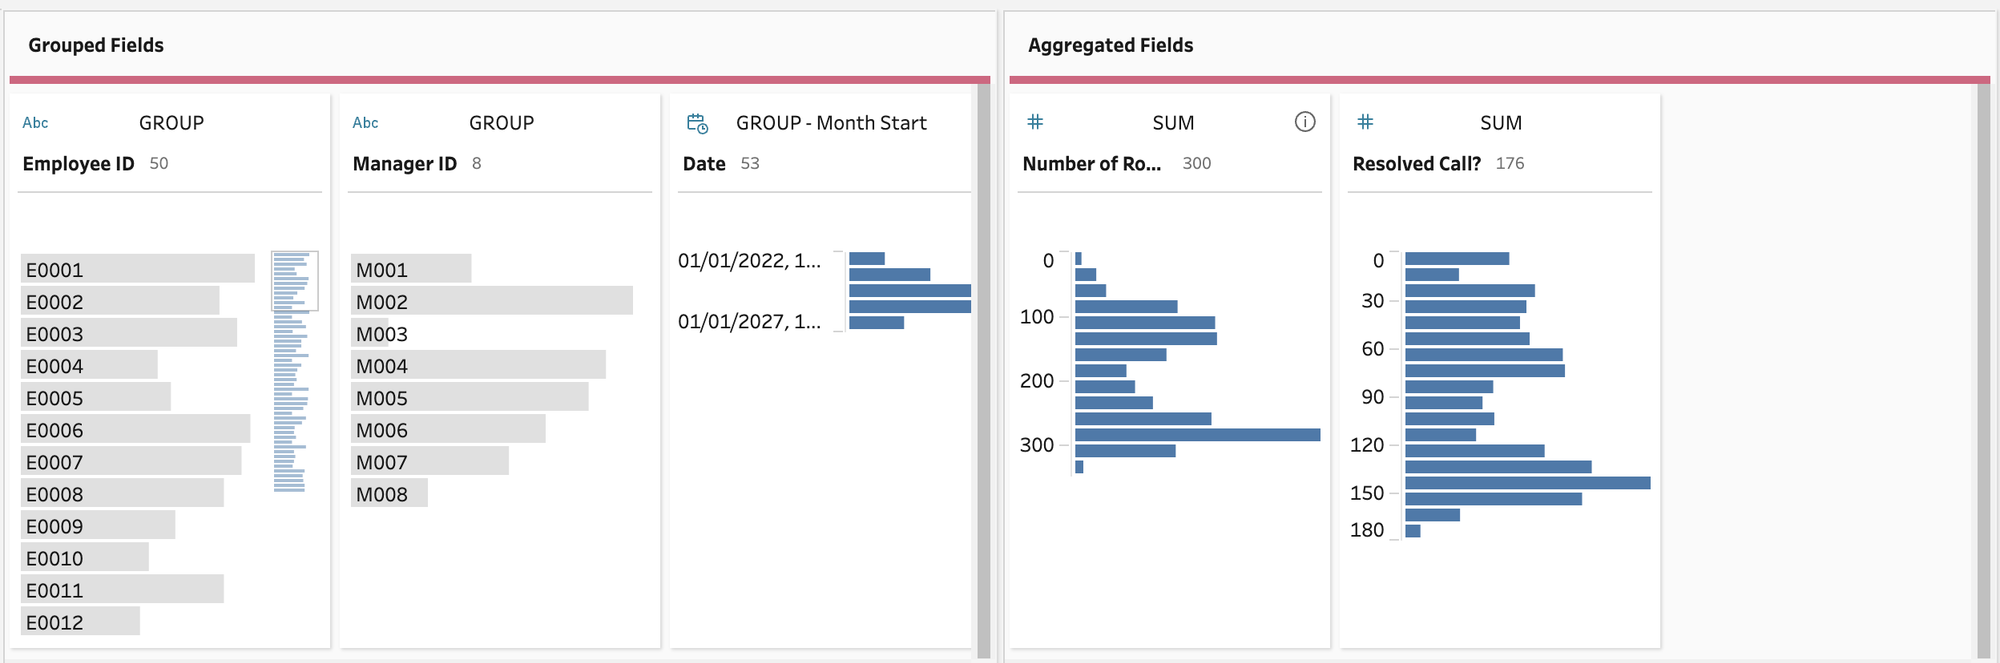
This UI has grouped fields (dimensions) and aggregated fields (measures). The way this reads is "Group these measures by these dimensions." In our case, "Sum the resolved calls and number of rows by manager and employee truncated to the level of month."
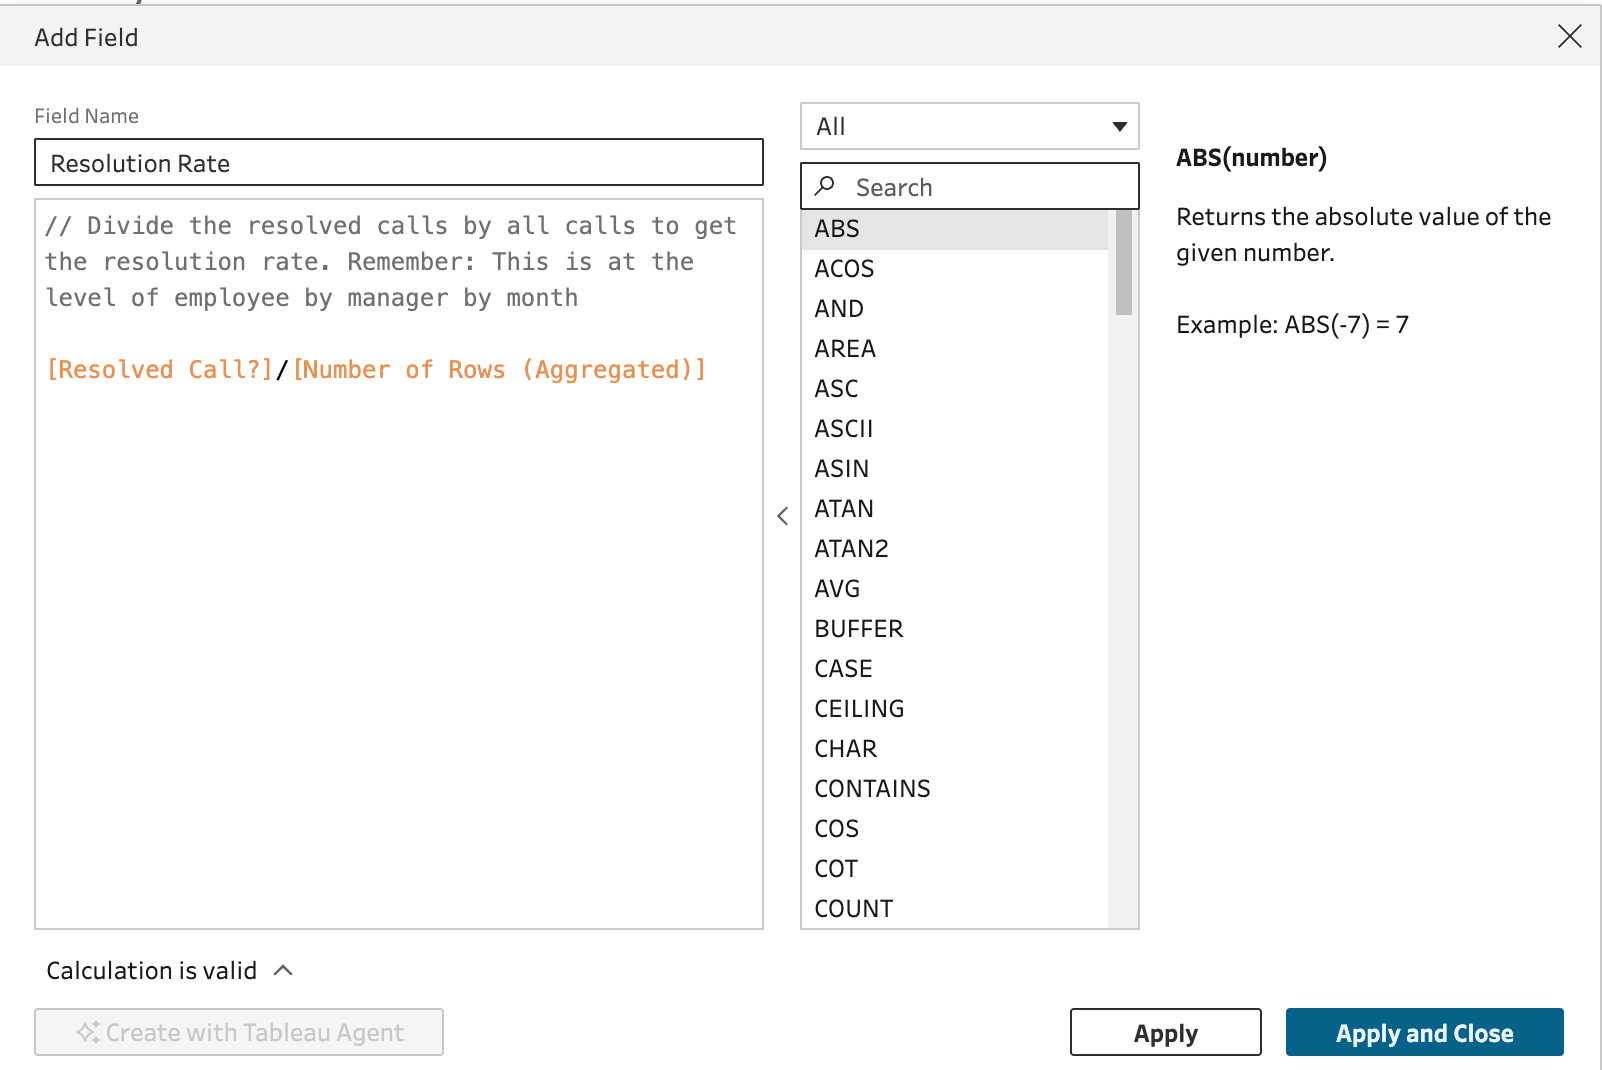
Now you can see what I created the binary field. I can just simply sum up the ones and divide it by the row count (i.e. all calls) to get my resolution rate calculation, which we will do by adding a clean step:
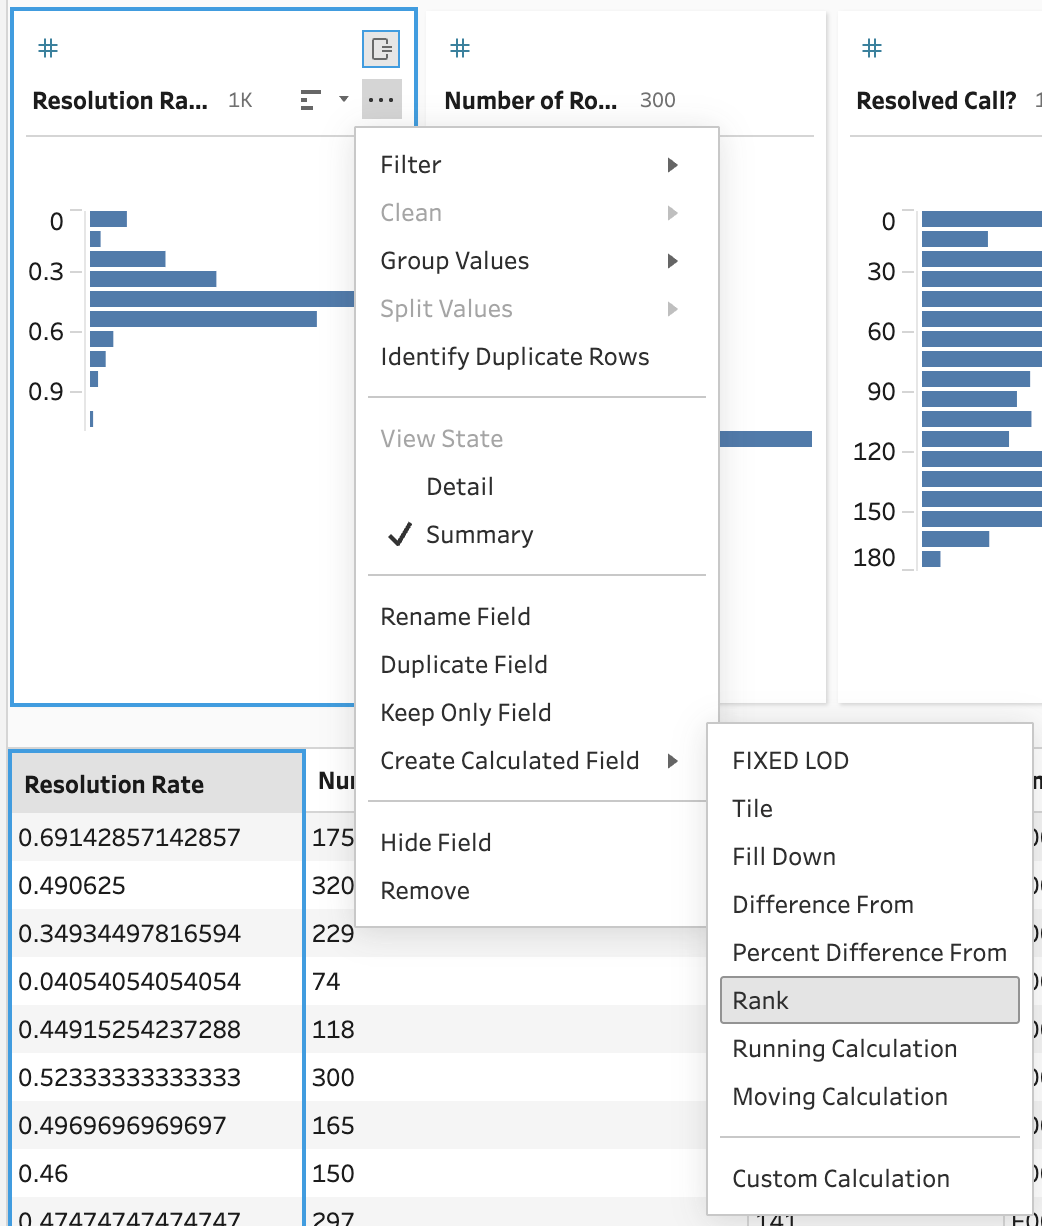
OK, we have our resolution rate calculated but we still need the rank of each employee by manager and month. We don't want to try to do this in the workbook for the reason mentioned above. Tableau Prep also makes this easy:
Which gives us then brilliant UI:
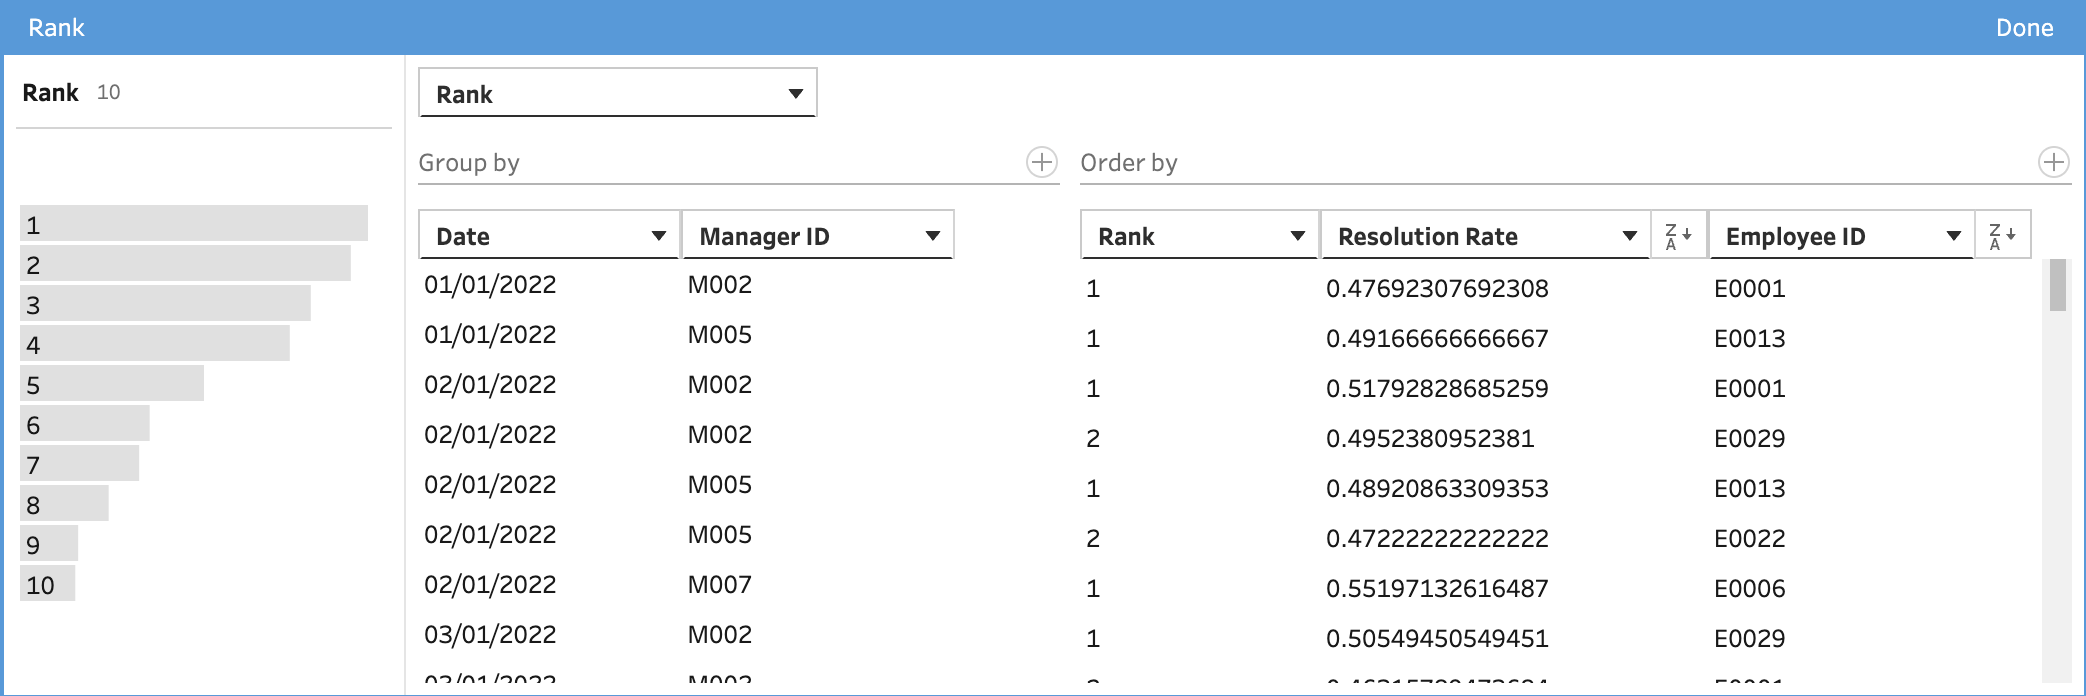
This also reads like a sentence: For every employee, rank the resolution rate by (or restarting) manager and month. We even get a nice histogram that shows the distribution of rank!
Let's finish up the flow by creating a second output from the same flow:
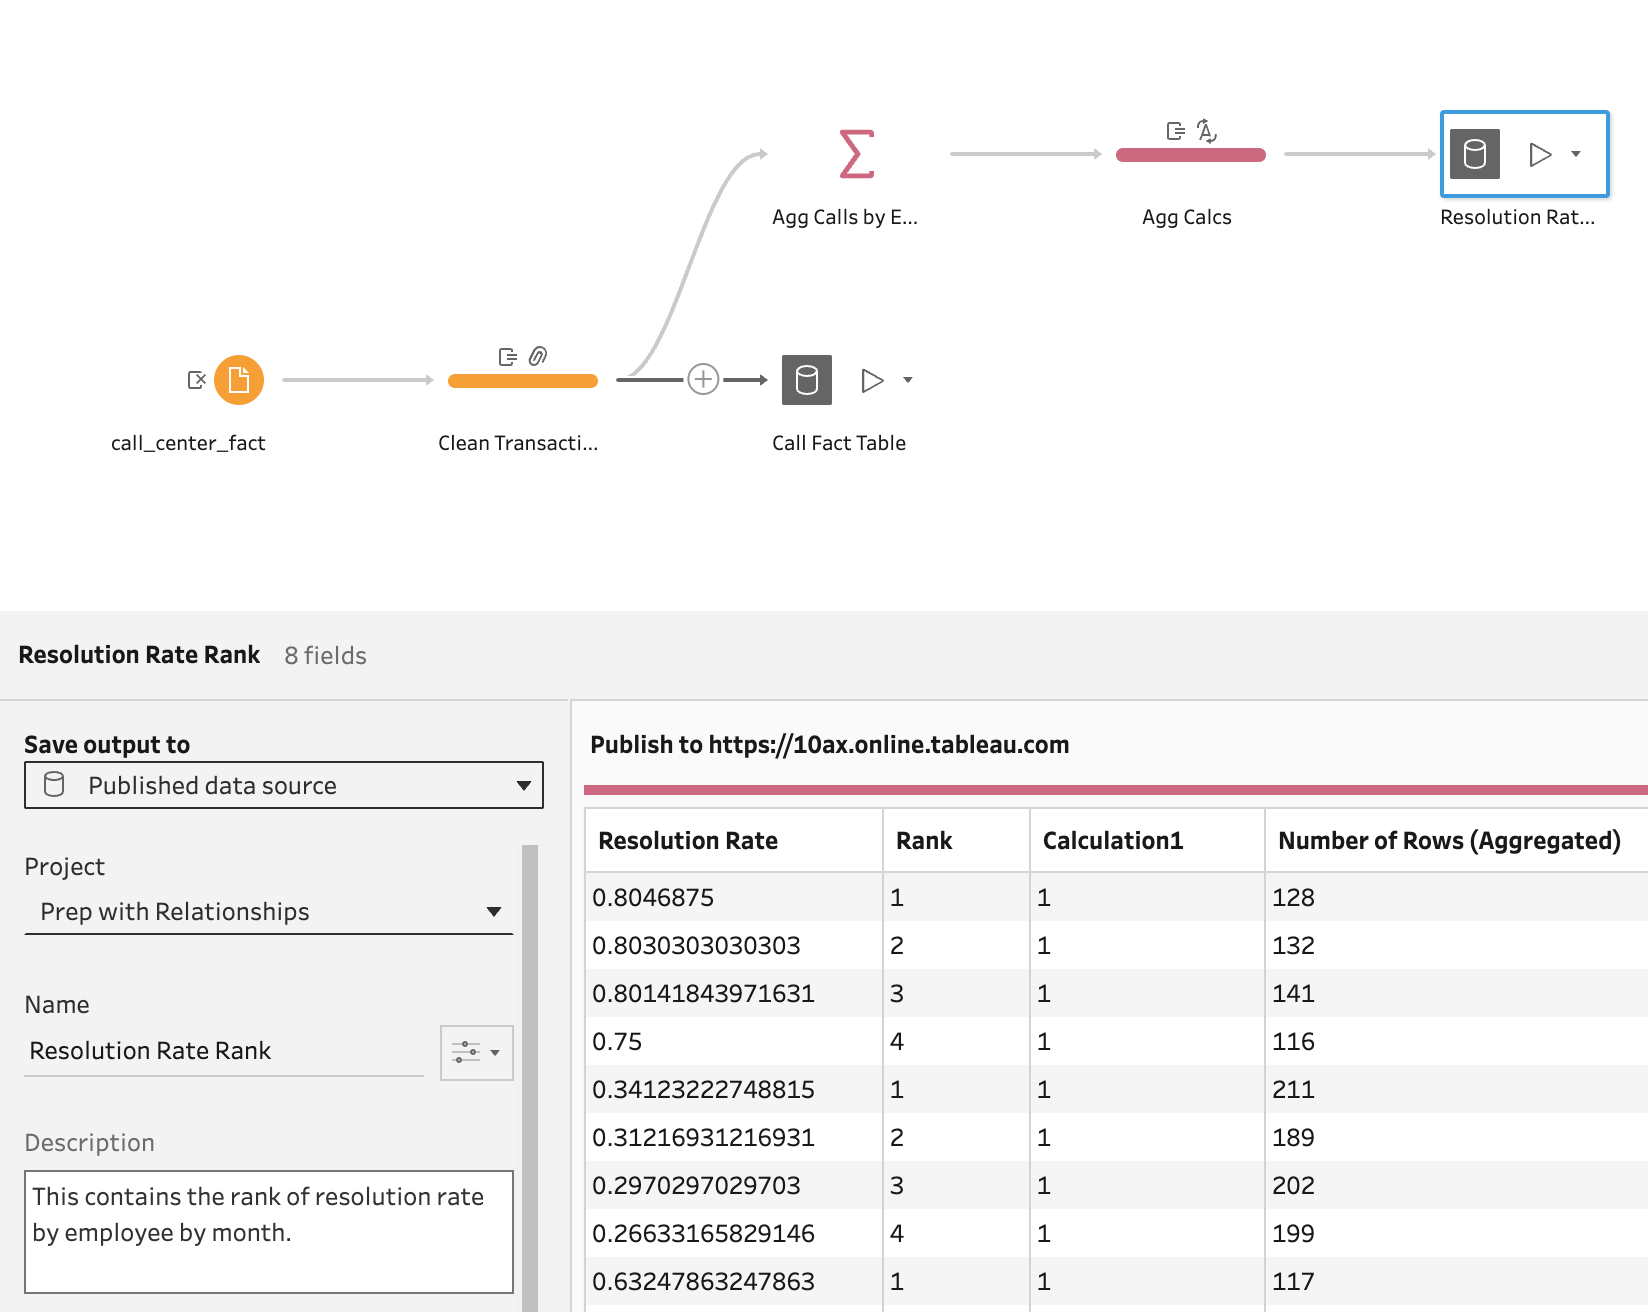
To this point, everything we have done in Prep is not new. These features have been in Prep for years. What is new is not even in Prep - it is in the way we can bring these outputs together. In this case, the brilliant thing it allows is speedy (and simple) answers on rank while still allowing for drill down to details!
Before we start to build this data source in a workbook, imagine that we also have three published data sources that we will also use: an employee table, a manager table, and a date table.
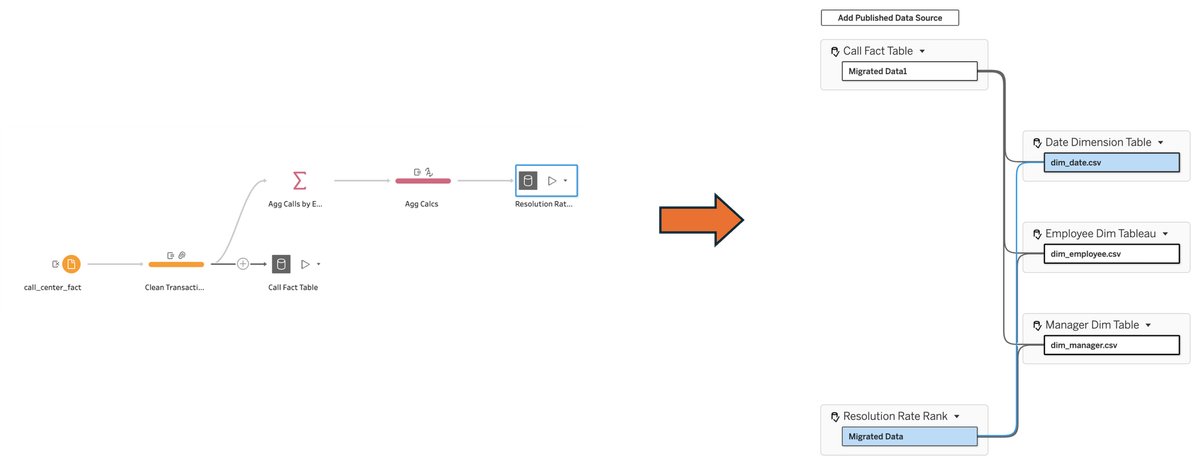
Let's open a new workbook and connect to the resolution rate data source (after publishing the flow and running the outputs):
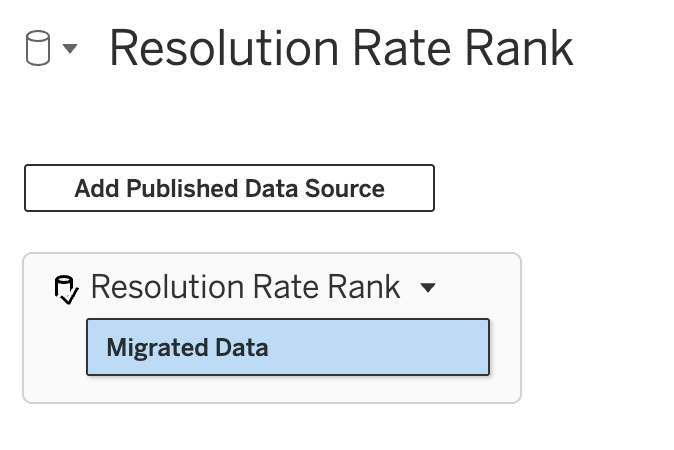
On our data canvas, we see the new feature - Add Published Data Source. Let's do that and add the cleaned up fact table:
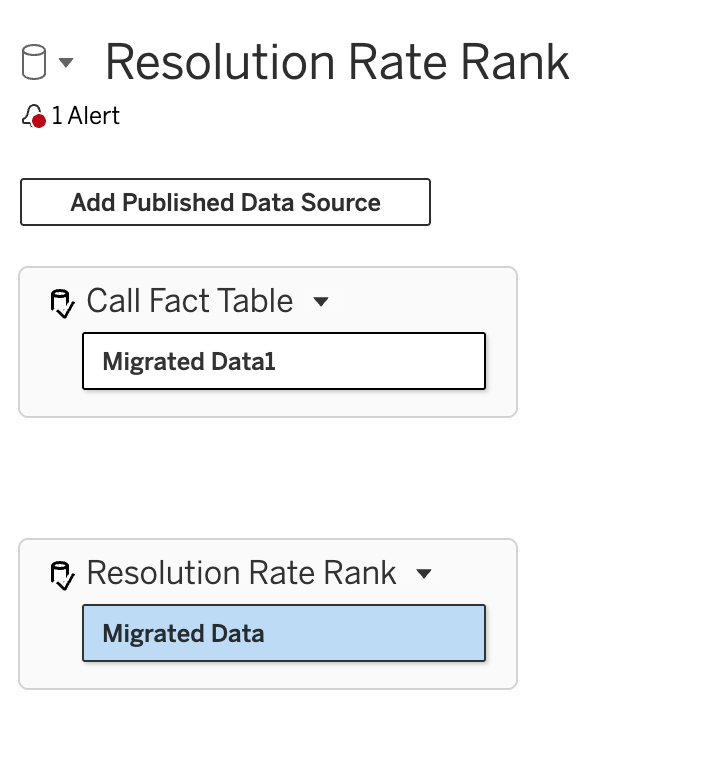
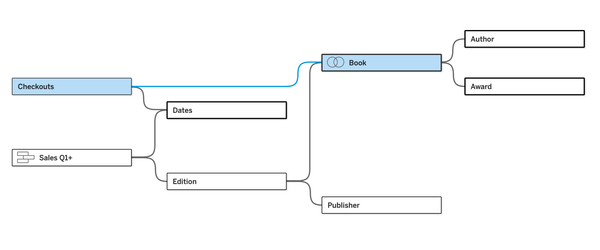
So there is no way to directly create relationships between these tables. That makes complete sense. What ties them together are shared dimension tables. (If this is not clear, I recommend going back to the post on multi-fact relationships.) As we already have published data sources for employee, manager, and date, we can add those one by one and then created the appropriate relationships with each of our base tables, until our final model looks like this:
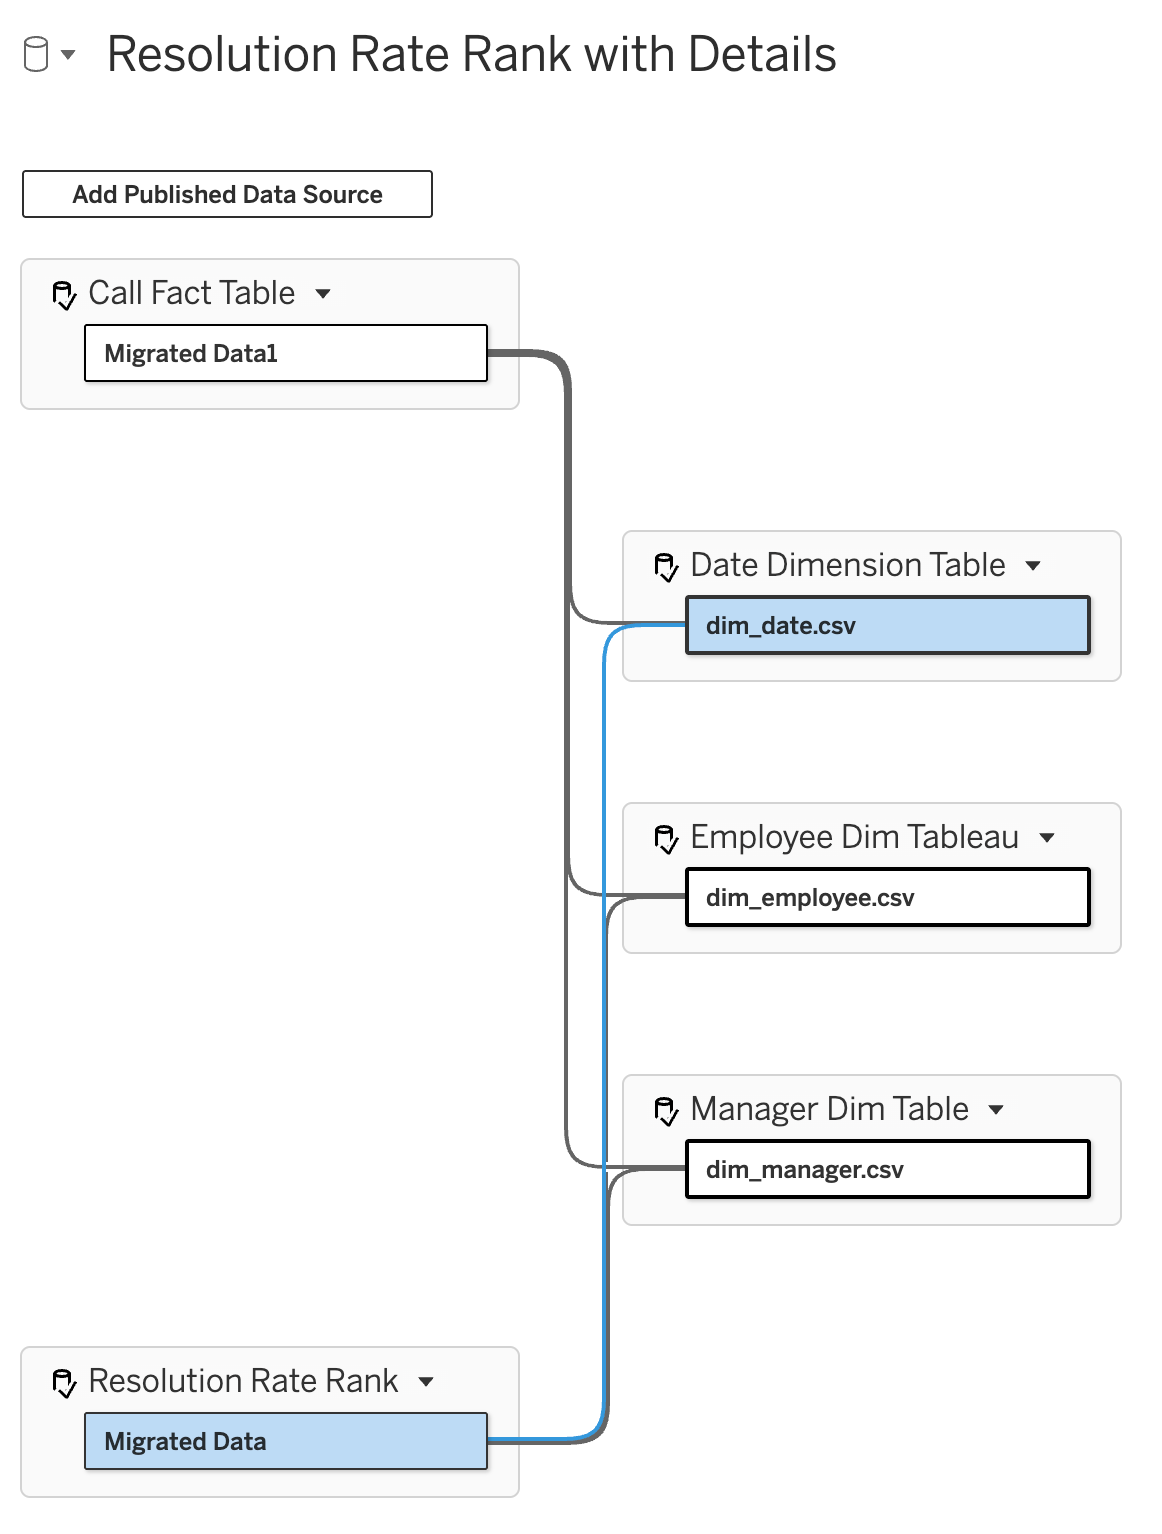
One thing to remember... the resolution rate rank table is at the month level so the relationship on the Date Dimension Table should be (and remember to watch the date level if comparing across tables):
One of the great things about this feature is we could either decide to publish this as a new data source (making it available to others, including agents) or we can keep it in our workbook, avoiding an explosion of published data source, yet keeping calculations where they should be - in certified data sources available to others.
Finally, we can now create our dashboard that:
- is highly performant
- allows drill-down to details
- either the detailed or aggregate table can be used independently or brought together in the same worksheet (at the month or higher level)
- no trade offs of pre-aggregated tables eliminating details just to get performance - the best of both worlds
Here is what the dashboard could look like:
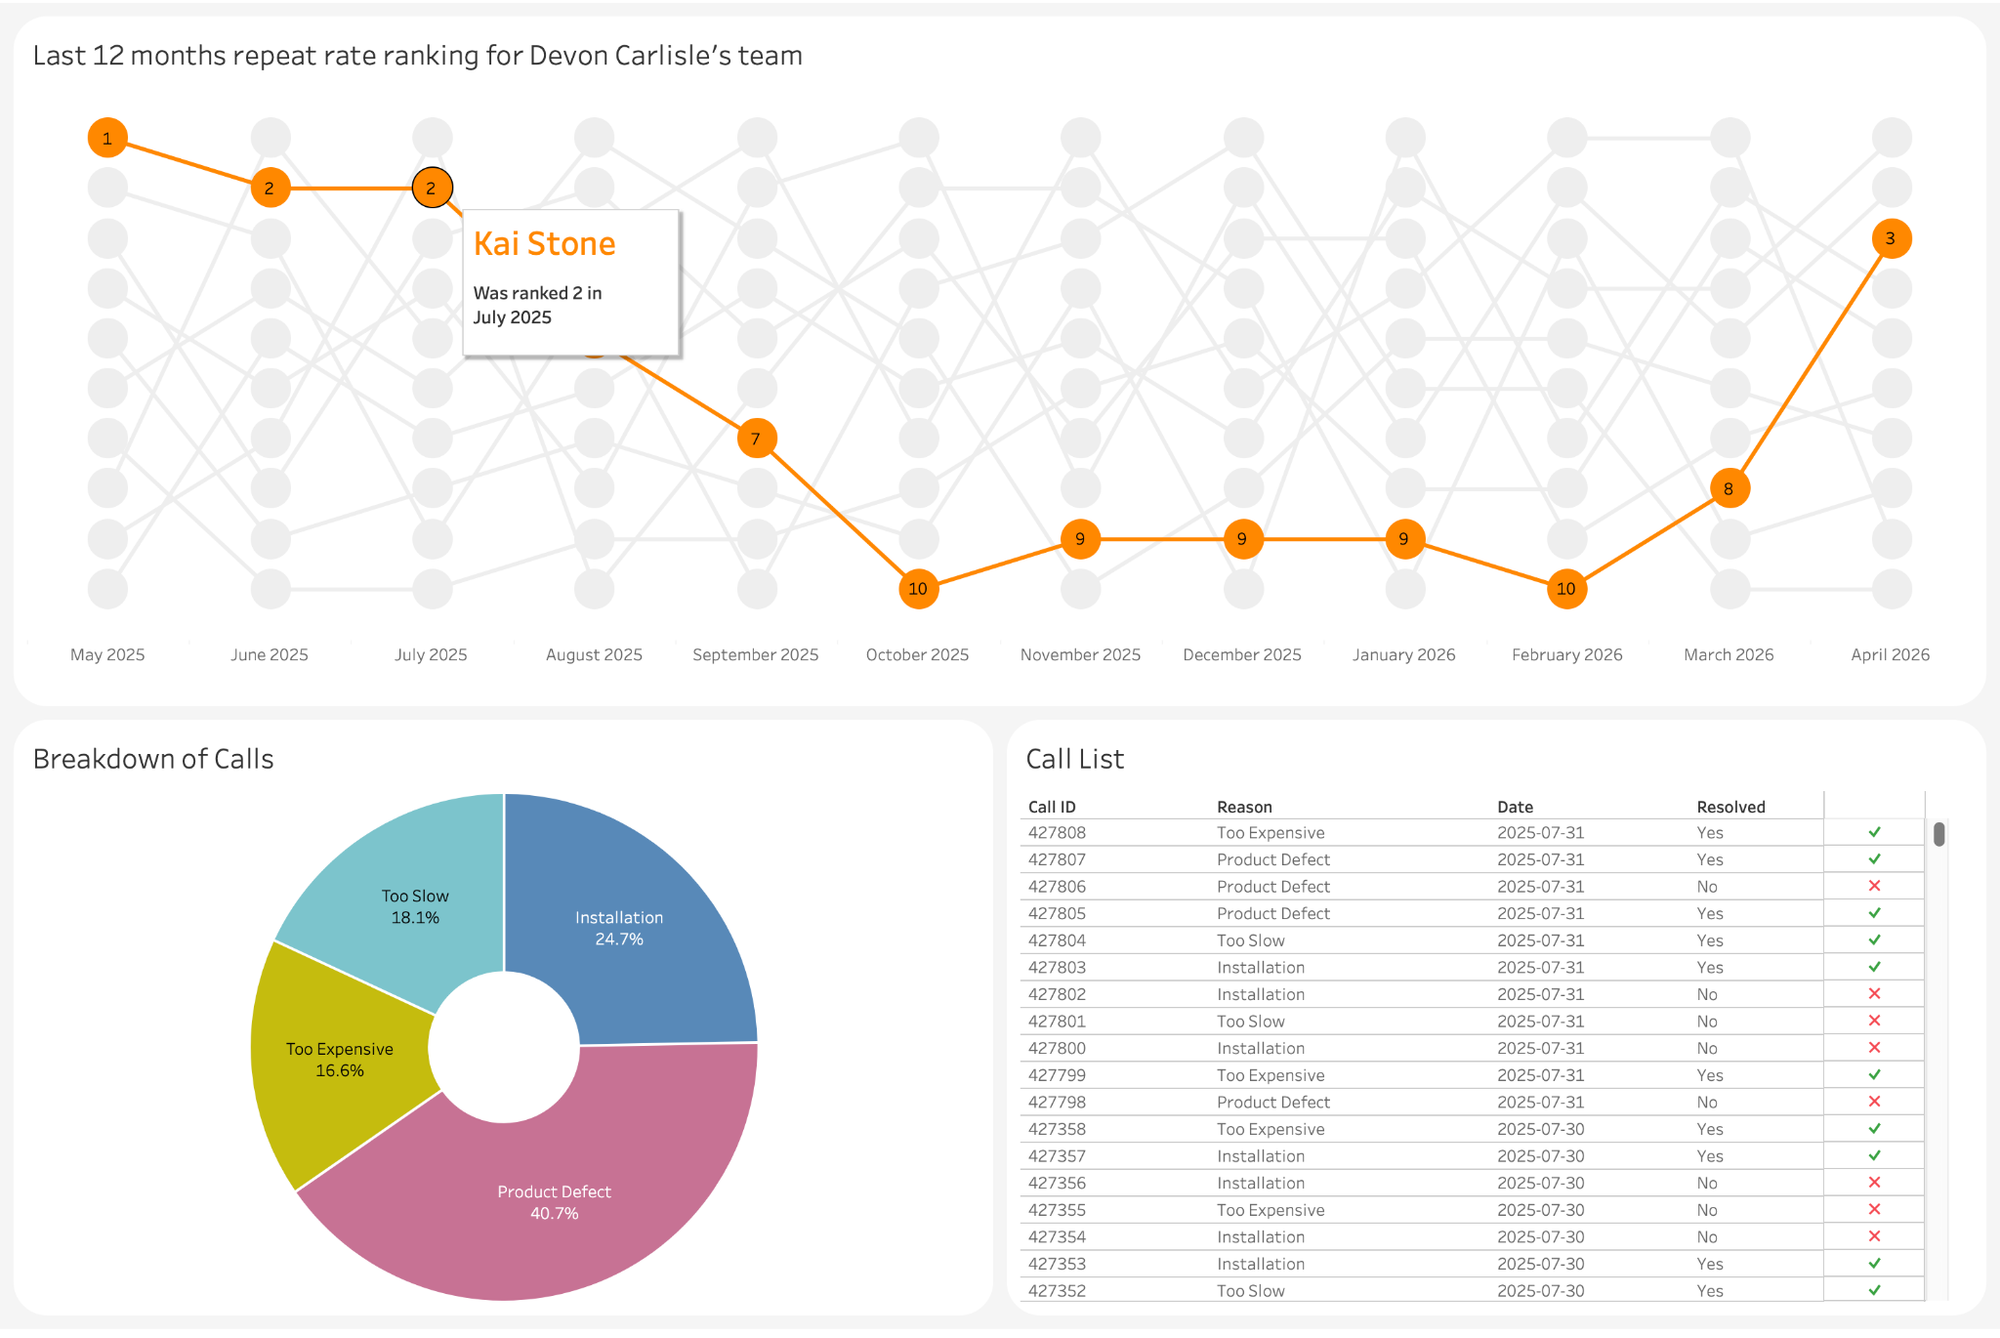
A monthly rank of employees filtered by manager. Interactive with dashboard actions. The top chart comes from the aggregated table, the bottom two from details. Dashboard actions allow it to be super responsive as we are always filtering the details by employee and month!
This is a Natural Extension of Where Tableau Has Been Heading
When you zoom out, this fits perfectly with Tableau’s broader evolution:
- blends
- published data sources
- a data Prep (ETL) tool
- relationships
- multi-fact models and shared dimensions
- VizQL Data Service
- view data model
- better answers from LLMs, internal and external to the platform (coming posts on this)
The platform has been steadily moving toward reusable composable semantic assets, if slower than we would have hoped.
Moving away from giant monolithic data sources.
Getting logic down the stack instead of trapped in workbooks - not duplicated calculations everywhere.
Now we have certified building blocks. Governed, trusted, reusable data with the flexibility of using Tableau Desktop with flat files.
My Recommendation Going Forward
I increasingly think teams should consider building and certifying:
Fact Tables
Clean transactional detail
Aggregate Metric Tables
Reusable pre-calculated business metrics
Dimension Tables
Clean conformed dimensions
Then let analysts and dashboard developers compose their own semantic models from those pieces.
That’s a much more scalable future than:
- massive workbook logic
- giant flattened extracts
- duplicated calculations across hundreds of dashboards
Final Thought
For a long time, Tableau Prep and relationships were these two great capabilities that we frustratingly couldn't bring together.
Prep was for shaping data. Relationships were for modeling data.
Composable data sources finally connect these together.
And I suspect we are only at the beginning of what this enables.