Why do relationships do that?
Part 1 of 2 - Single base table
Tableau released the relationships feature (aka object model; aka the noodle) six (6) years ago in the 2020.2. In my experience, it is still an underused feature because people don't understand how the model leads to the creation of joins at runtime. This purpose of this post is to clean up that confusion.
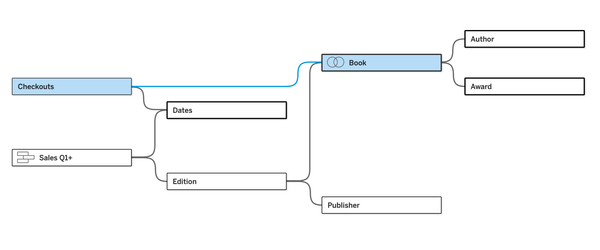
If you want to follow along in Tableau Desktop, you can get the data on Tableau's website. To begin, you can select all four sales tables and drag them to the canvas together. This will union them for you. Then, if you double-click the other tables (Excel sheets) and the model will build itself as the right field names match. Near auto-semantic modelling without AI!
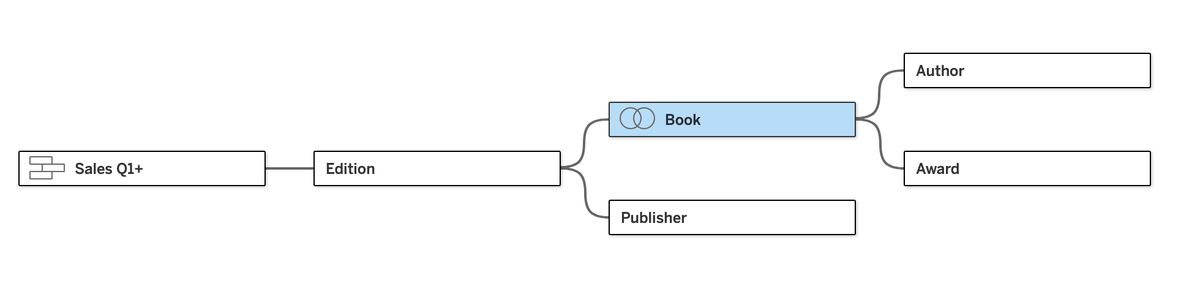
The one exception is going to be the Info table. In my model, I've joined Book with Info. Why? The biggest advantage of relationships is that they allow you to leave data at their natural grain. When you join data at different grains, you "explode" your data which leads to very unnatural aggregations. In Tableau-speak, this means lots of LODs, COUNTD vs COUNT, and other expensive and complicated calculations. It often always leads to the elimination of some answers from your data.
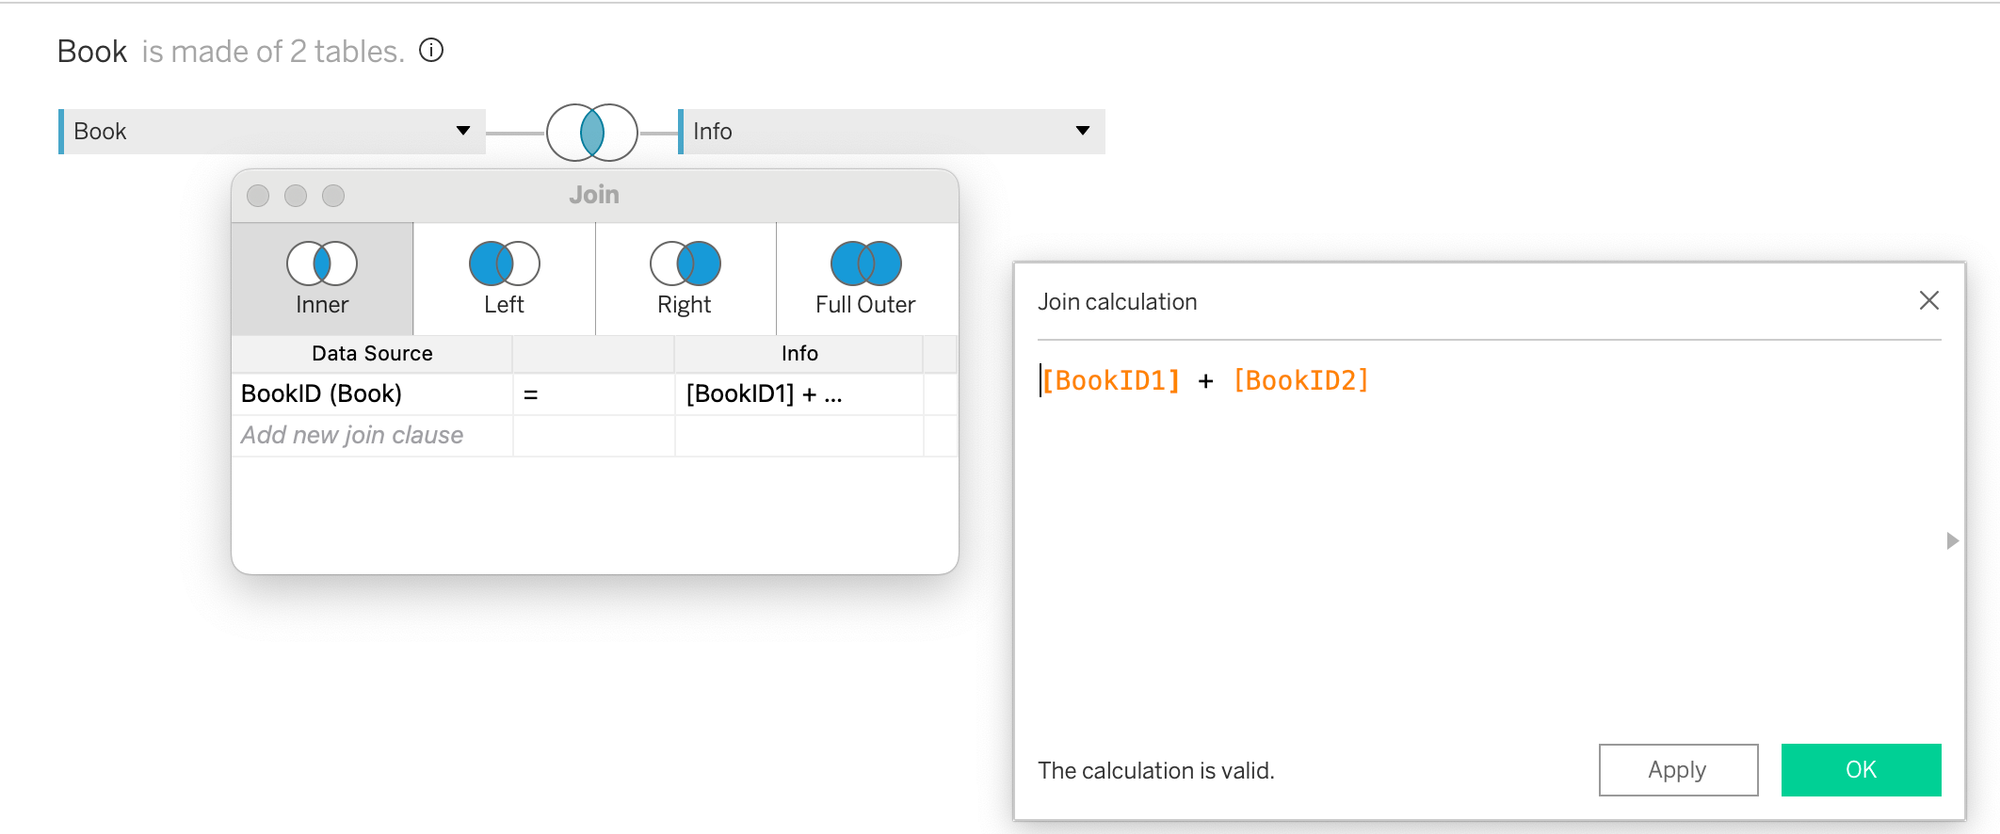
On the flip side, if you have two tables that have the same number of rows and if an inner join between them would result in the eliminate of no rows, pre-join them! Why get Tableau to dynamically create the join over and over again if you know the result is always going to be the same. Let's pre-join them into a single, logical table in our model (and it requires a join calculation with Info because the Book ID field is broken into two fields in that table):
Now, how did I know that these tables were at the same grain? We'll wrap up this post with that answer, after going through how relationships work.
Now that we have a data model, let's look at how Tableau converts these relationships into joins when we build out visualizations. By dragging AuthorID, First Name, and Last Name to the view, we see that Tableau gives us a list of all our authors. Makes sense.
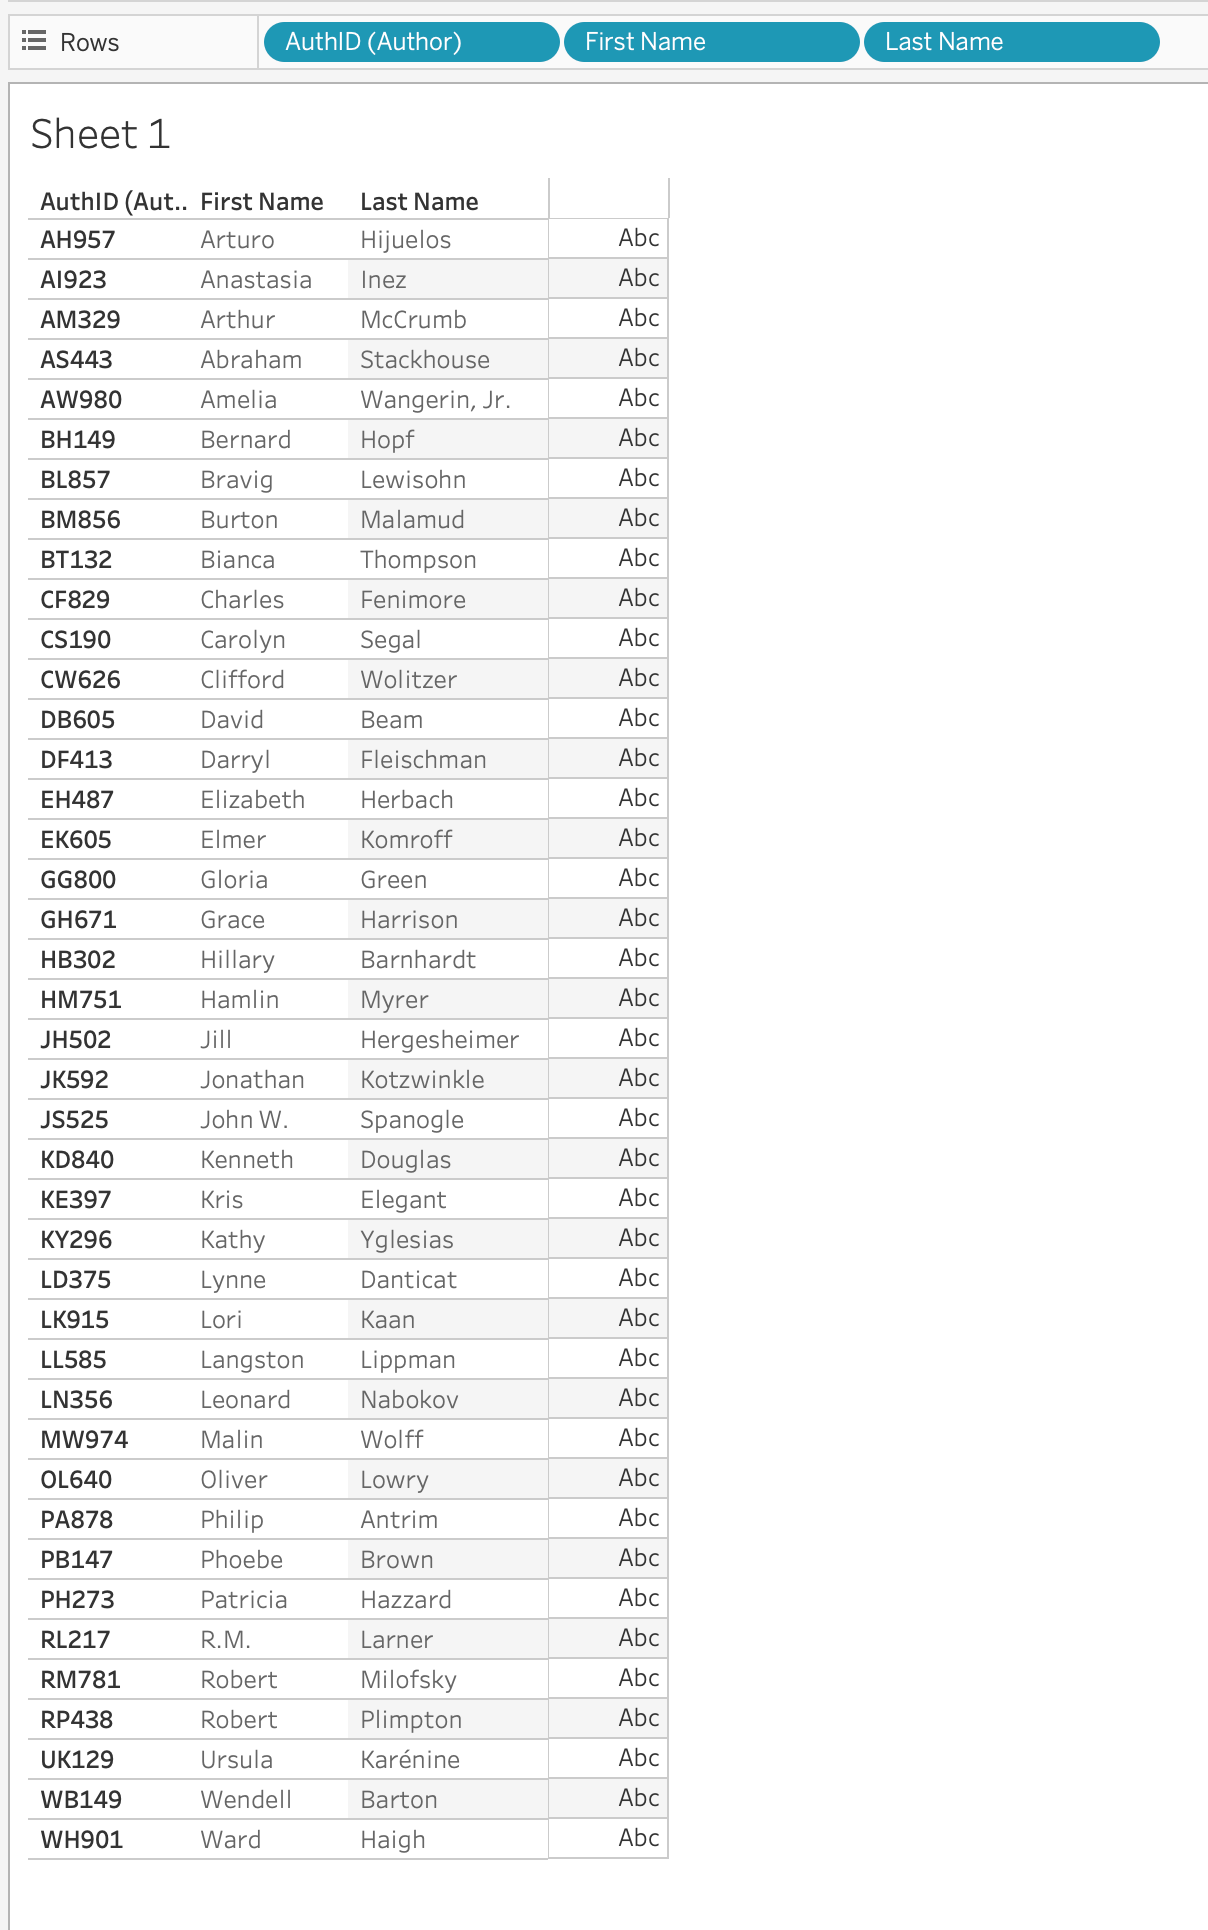
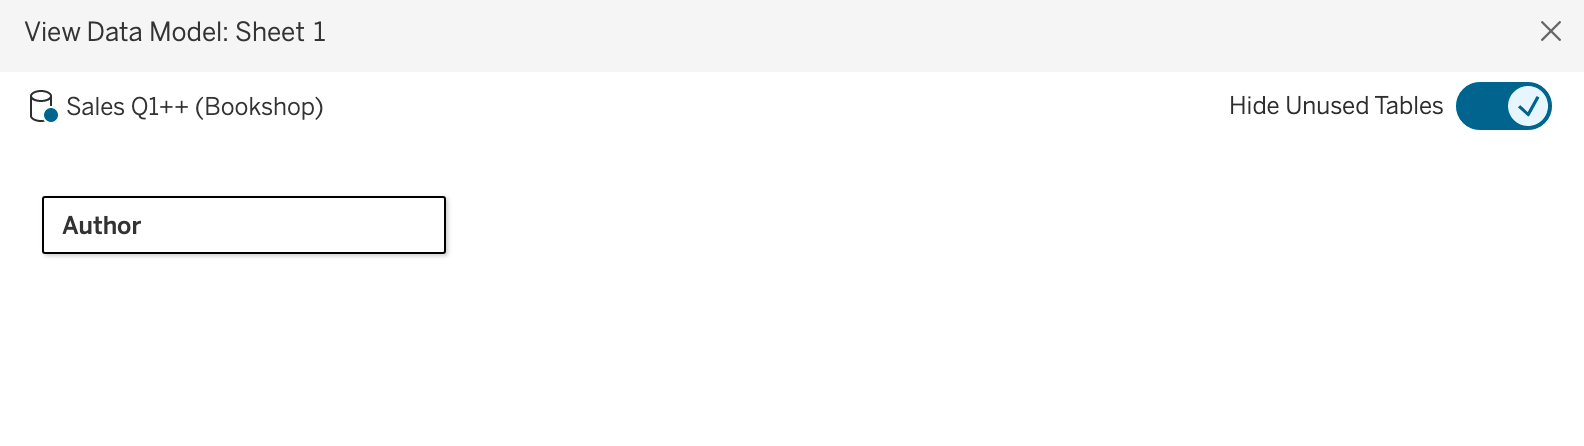
And... we have a count of 41 authors. We can also go to the menu options and select Worksheet --> View Data Model and toggle Hide Unused Tables. We can see that Tableau only needs to query the Author table to get us that result (leave this dialog box open on this setting as you go to see the impact of the fields that are brought into the view):
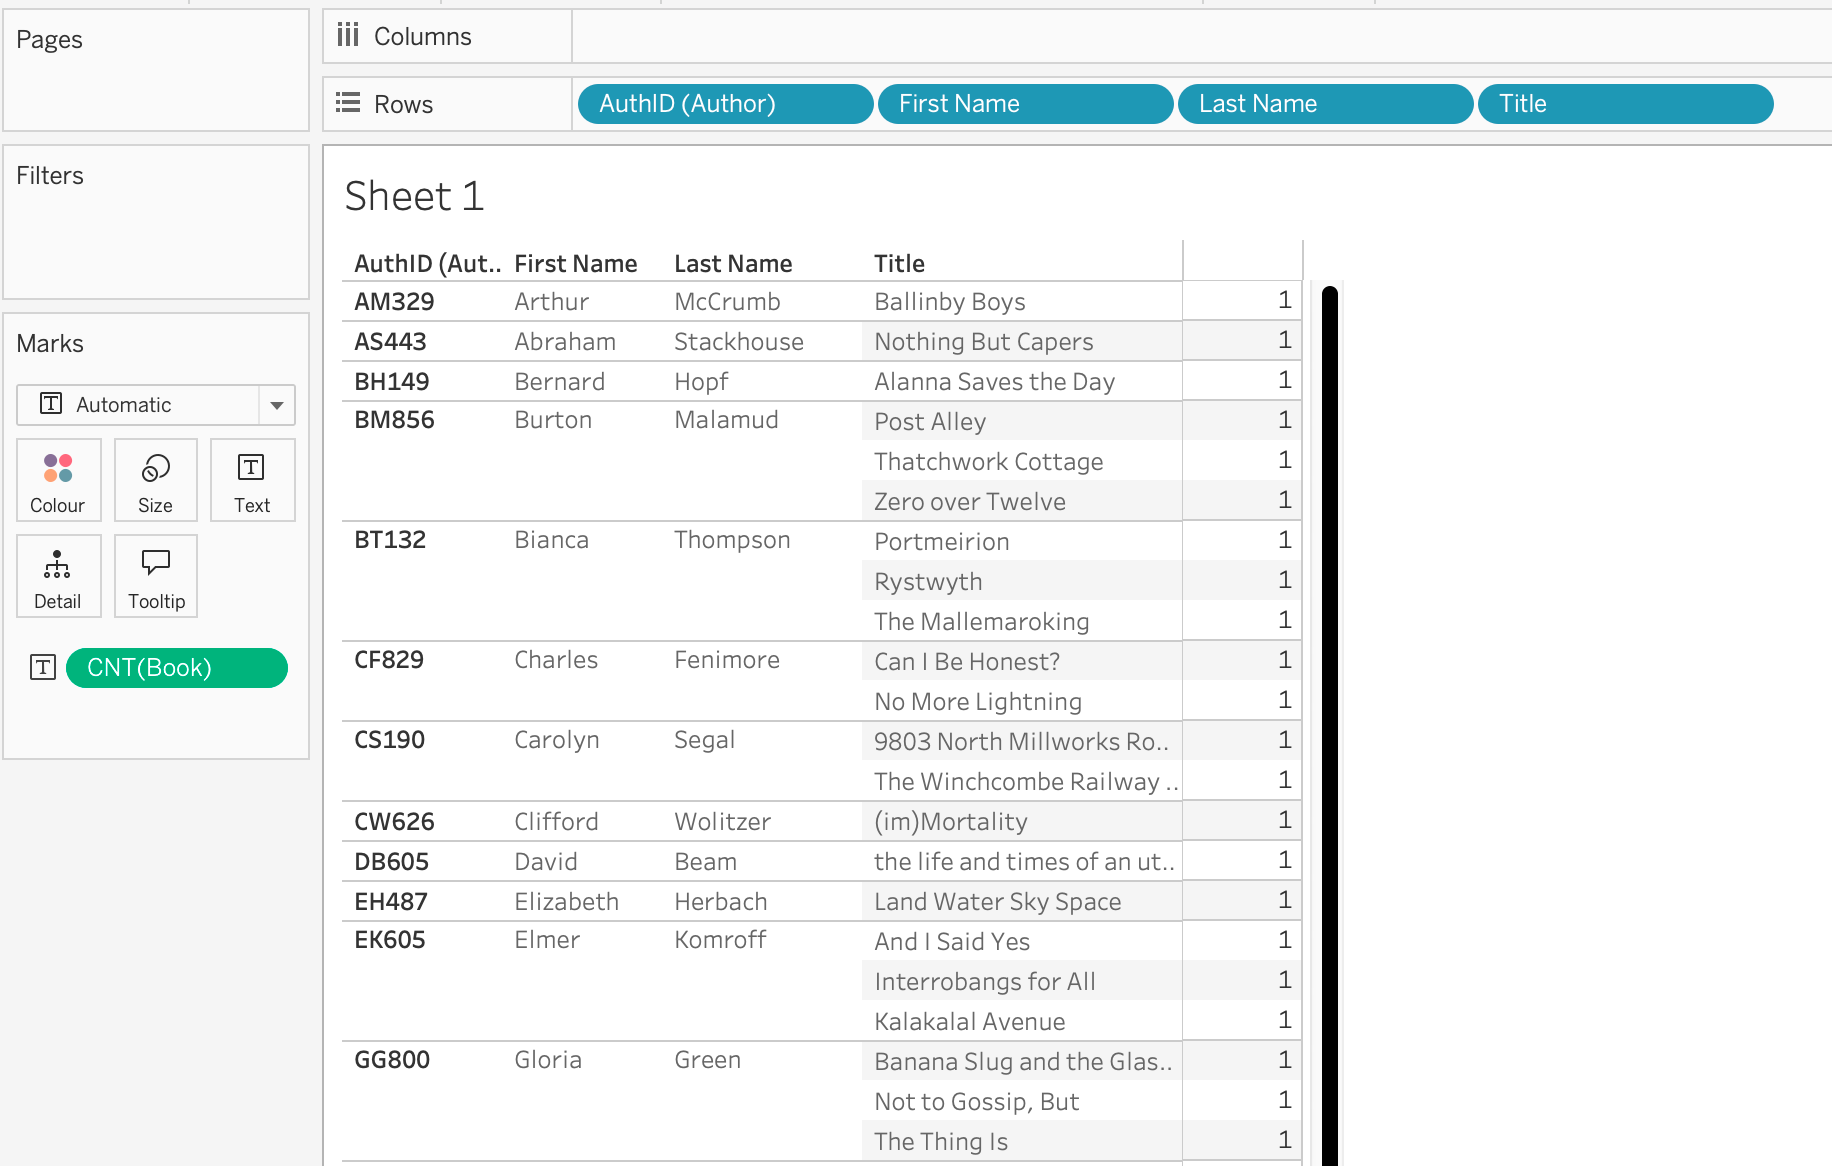
What about the books that authors have written? Let's pull Title from the Books table into the view. Now, our marks jump to 58. In other words, there are now 58 rows instead of 41. The reason is that some authors wrote more than one book. However, if you do a count on AuthorID, you will notice that there are only 34 authors. Seven (7) authors are no longer in our view.
What happened? When you bring dimensions - without measures - in from two or more tables, Tableau inner joins the tables. In business speak, this means that Tableau interprets your request as, "show me all the authors who have written a book."
This often results in people thinking that relationships always cause inner joins, but they don't. The key to get an outer join to any table is bring in a measure from that table. And Tableau makes this easy for you by giving you a row count of every table as an automatic measure.
While doing this, remember that the table we pull it in from matters. For instance, if we pull the Book (Count) field into the view, we are going to get the same 58 rows, because the outer join to the Books table is the same as an inner join between Books and Authors. In business speak, "there are 58 books in the book table, no two have the same title, and none of the books have multiple authors."
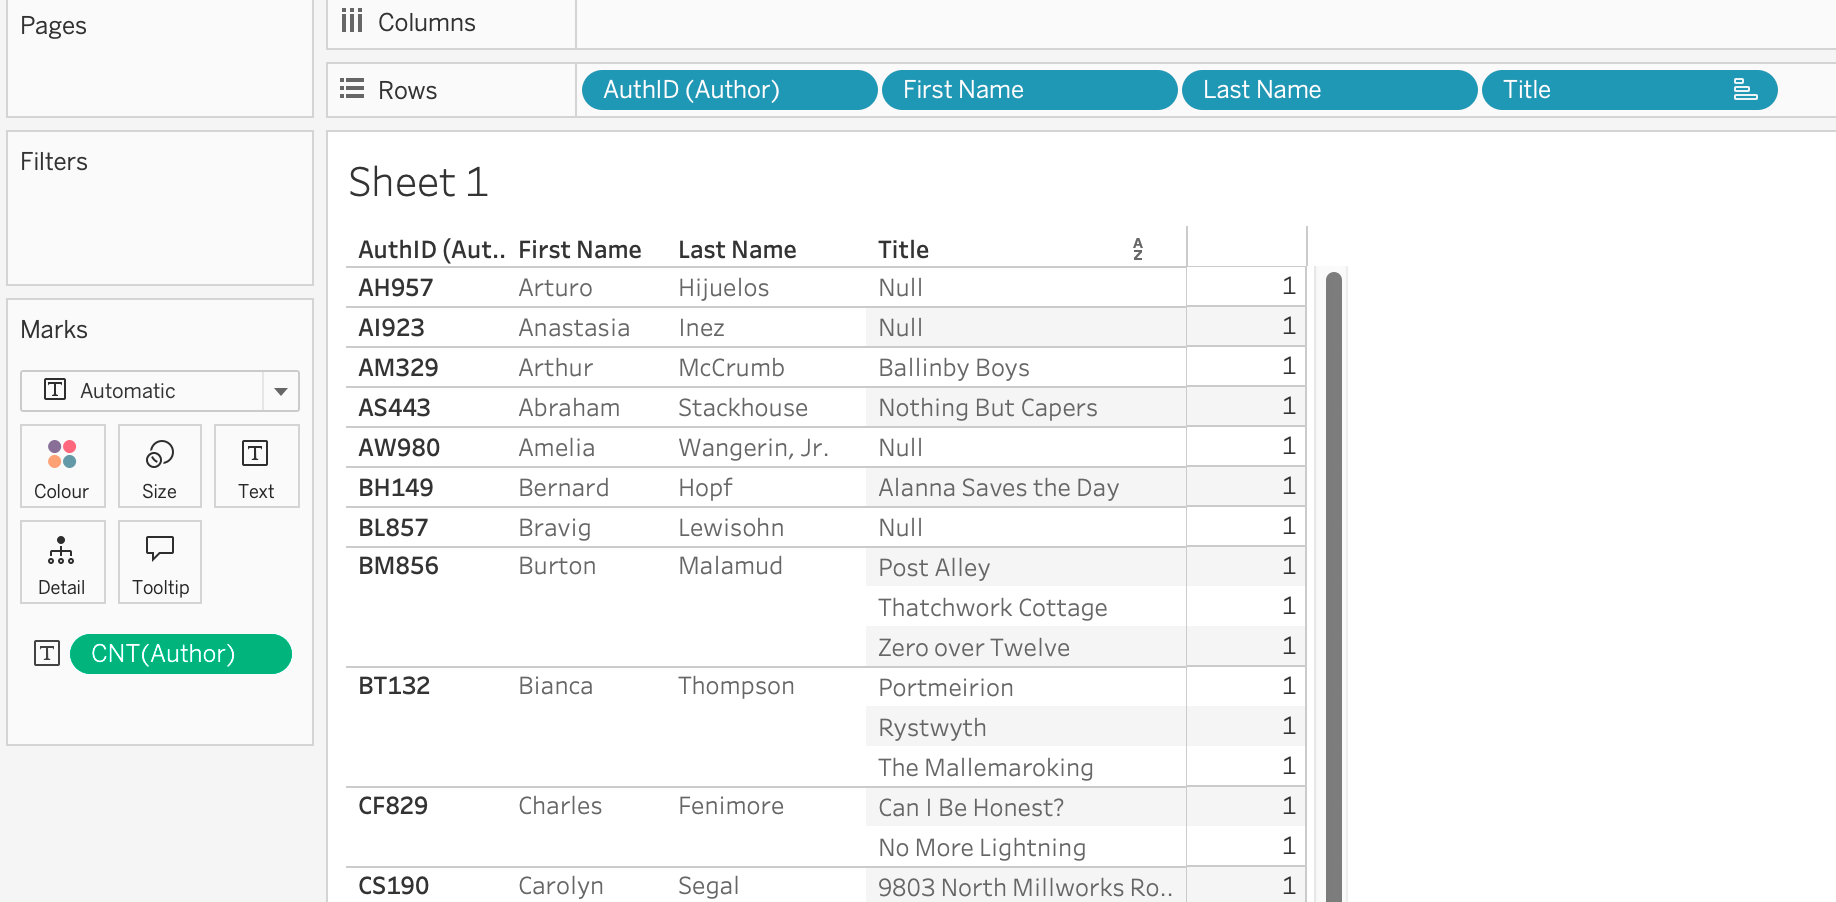
However, if we pull the Author (Count) field in to replace the Book (Count) field, we get a very different result and 65 marks (also rows in this case). Why? Tableau is now showing us the 58 rows for books plus 7 rows, one for each author without a book with a NULL in the book title. In SQL speak, this is because the outer join to the Author table exposed 7 rows that didn't exist in the Books table. In business speak, "there are 58 books in the book table, plus we have an additional 7 rows for the authors who have not (yet presumably) written a book."
To take this a step further, duplicate the Title field to the filters shelf, select only NULL and get a clean list of the authors who haven't written a book. This is - by far - my favourite feature of relationships. Being able to answer the "what didn't happen" questions! These answers are almost always filtered out when you join your data before analysis.
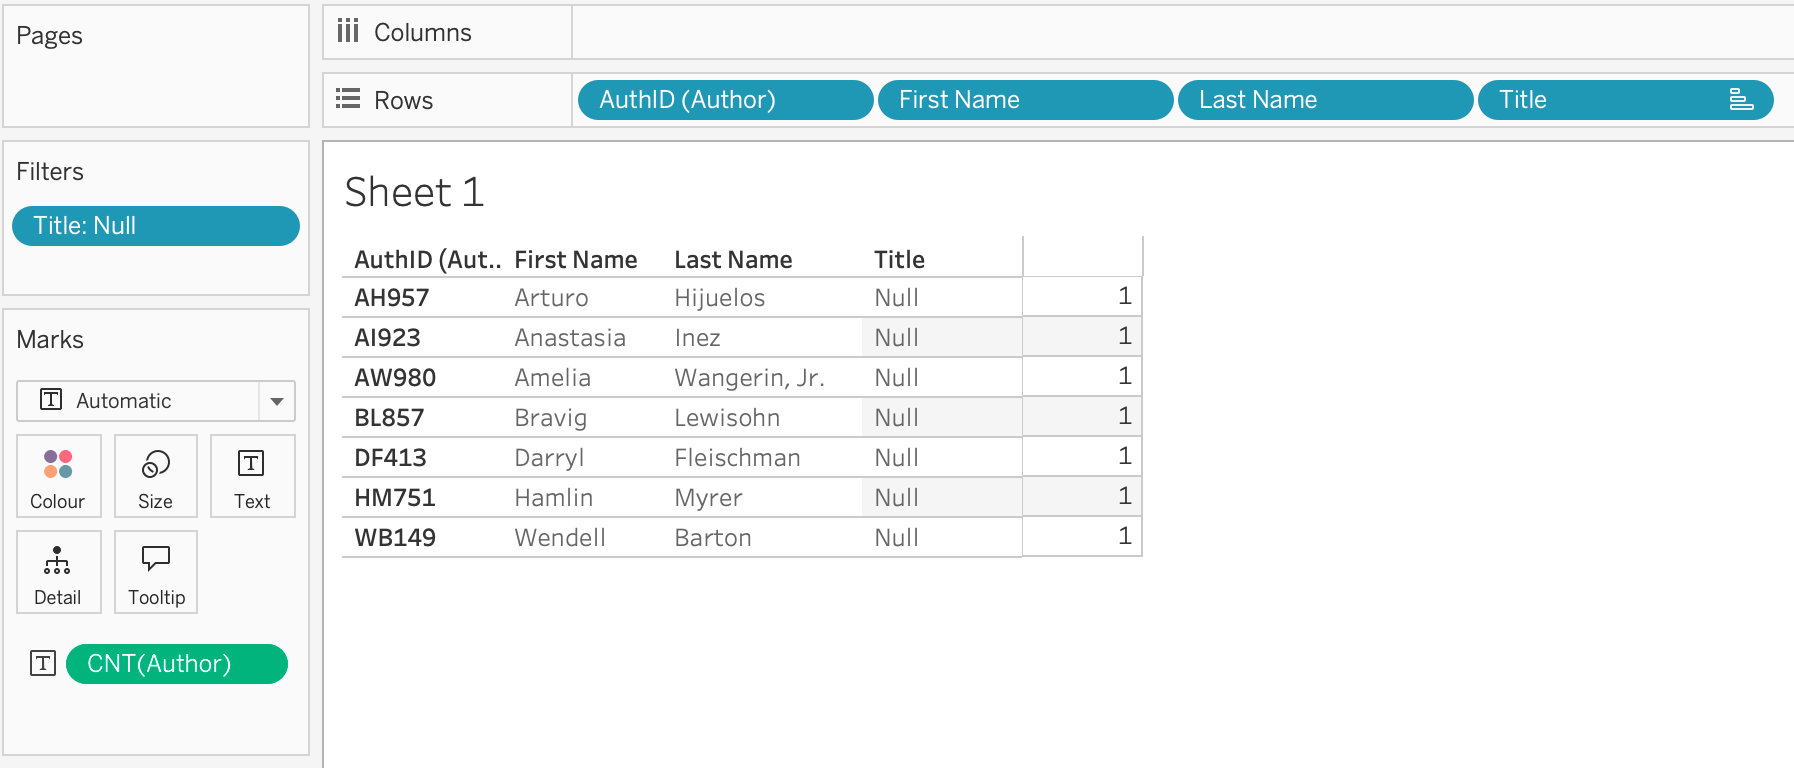
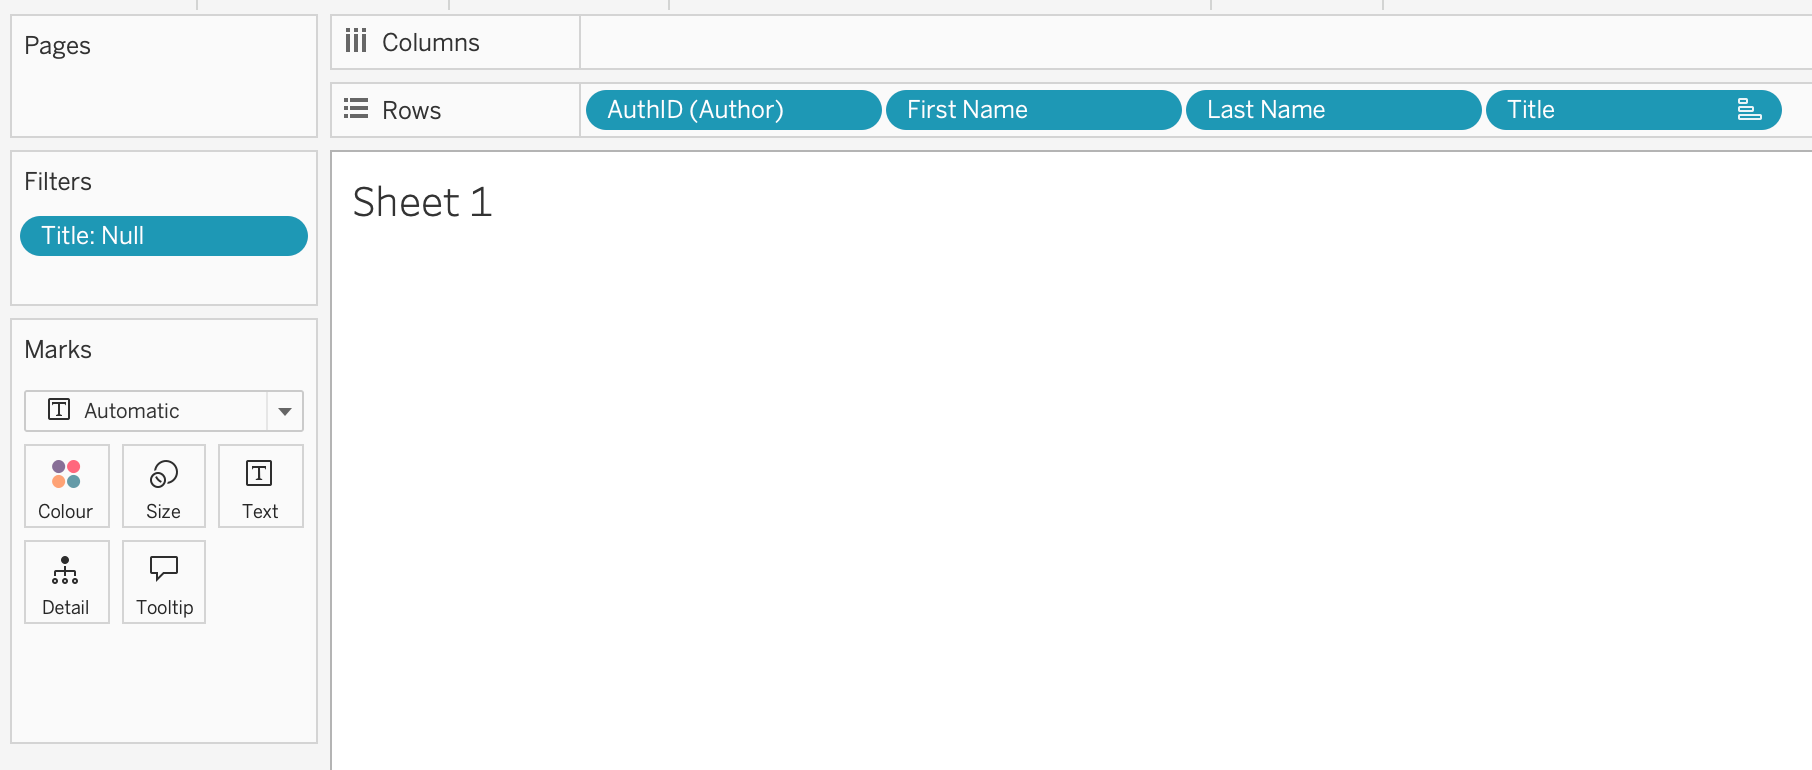
One important thing to remember here is that a measure - in this case a simple row count - needs to be in the view from the table where we are looking for missing records. Otherwise, the inner join will eliminate the NULLS:
There you have it. Relationships are very powerful but the results can be confusing unless you know the following:
Dimension to Dimension - Inner Join
Add a Measure - Outer Join to that table
Understanding that simple heuristic, along with using View Data Model to make sure you understand where fields are coming from, allows for powerful analysis without exploding your data!
One last thing before close. How did I know the Book and Info table had a complete matching of rows? By knowing the rules above. I created a relationship between Books and Info (using a relationship calculation of BookID1 + BookID2). Next, I pulled in a dimension field from each table, then I pulled in a measure field from each table. The row count never changed so I know that an inner, left outer, right outer, and full outer would all give me the same result. In this case, creating a single, logical table from the two tables on an inner join made sense. Why ask Tableau to create this join at runtime when the results will never change?
Next up - how these heuristics change when we have multiple base tables in a multi-fact relationship (sometimes called shared dimensions) model.