Tableau’s Evolution to Composable Data Sources
When working with people who are new to Tableau and using it in enterprise environments, I'm usually asked the following within a few weeks of them starting:
“Wait… are you saying I can't build relationships on top of published data sources?”
The natural tendency, especially for data engineering teams, is to want to publish tables as data sources and then let the business analyst teams construct their own data models for analysis and dashboards.
From 2026.2 forward I'm really looking forward to responding with:
“Yes, in fact that is what I would call best practice.”
This is enabled by composable data sources and I think this capability represents one of the biggest architectural shifts Tableau has made since relationships were introduced. And not because it adds another feature checkbox... it fundamentally changes what a “data source” is.
For years, Tableau architecture has treated published data sources as endpoints. You built them, certified them, governed them, and connected workbooks to them. They were designed to create trust and consistency across an organization and they solved a real problem.
Before published data sources became common, Tableau enterprise environments were chaos with all the logic embedded in individual workbooks:
- duplicate calculations
- inconsistent KPIs
- dozens of Excel-style business logic implementations
- no governance or no trust
Published data sources helped centralize logic and standardize analytics, but they also introduced a limitation that has frustrated many of us:
You could connect to them. You could not build on top of them.
That limitation shaped Tableau architecture for years.
The Evolution of the Tableau Data Model
Looking back, Tableau’s data architecture has evolved in fairly distinct phases.
Phase 1: Blending (Tableau 6.0 - November 2010)
Blending was Tableau’s first real attempt at composability. Blending got us out of the one big table (OBT) architecture.
Blending allows for the combination of data across tables without physically joining them together. The problem is that blending is fragile, worksheet-scoped, difficult to reason about, limited to one aggregation level, and often results in really slow queries.
Blending did expose something important though: People want to answer questions across domains. Not everything belongs in one giant physical table.
Phase 2: Published Data Sources (Tableau 7.0 - January 2012)
Published data sources (PDS) introduced trust and reuse:
- centralized calculations
- certified sources of truth
- governed dimensions
- reusability
This was a big step forward, but architecturally, published data sources are still fairly static. Once they are published, they behave more like finished products than reusable building blocks.
The architecture of PDS is “this is the source” not “this is one layer of a larger semantic architecture.” This distinction matters a lot.
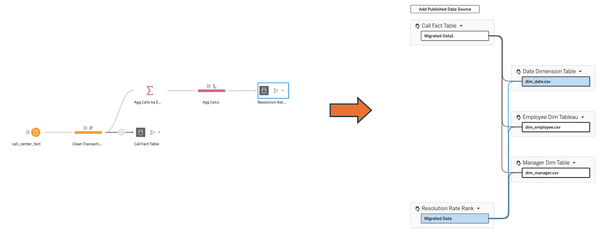
Phase 3: Tableau Prep (Tableau 2018.1 - April 2018)
Tableau Prep was the first time that Tableau allowed us to clean up our data and push calculations further down the stack to help with performance. Before Prep, Tableau analysts had to rely on tools like Alteryx or make requests of their data engineering teams to clean up data and pre-calculate fields for them.
Prep empowers Tableau teams to get moving faster. However, the one big drawback is that Prep only allows for outputs that are published data sources, and as already mentioned, they are dead ends in terms of being extensible with other data.
(Technically, Prep can write to database tables which can be used in relationships. The practical issue is that most Tableau analysts don't have the access and permissions to write to databases.)
Phase 4: Relationships (Tableau 2020.2 - April 2020)
Relationships changed how Tableau thinks about queries.
Instead of forcing developers to flatten everything into one giant joined table, Tableau started understanding tables as independently aggregated entities connected by semantic relationships.
This was a massive step forward in data modeling:
- different levels of granularity became manageable
- many-to-many scenarios became realistic
- query performance often improved
- the door was opened to much larger data models
- logical modeling became possible
However, relationships do not solve the problem of published data sources being endpoints and not extensible components.
Phase 5: Virtual Connections (Tableau 2021.4 - October 2021)
Virtual connections offered promise for composability. Individual tables could be mapped to underlying data tables allowing for reuse at the connection level.
Virtual connections never really met their promise in a number of ways:
- query performance was unpredictable against live tables
- the feature is only included in higher pricing tiers, making in inaccessible to many
- underinvestment after initial release
- doesn't solve the problem of published data sources as endpoints
With the release of composable data sources, I am not sure that there remains a good use case for virtual connections outside of some rare row-level security requirements. (Happy to debate this in the comments!)
Phase 6: Multi-Fact Relationships - aka Shared Dimensions (Tableau 2024.1 - April 2024)
This is where things started getting really interesting. Multi-fact relationships introduced the idea that multiple fact tables could share common dimensions. Separate fact tables. Shared business dimensions.
This is where Tableau started acting less like a traditional visualization tool and more like a semantic query engine.
This allows for being able to see correlations across different areas of the business:
- do sales go down when support calls go up - by customer, by product, by region?
- are sales representatives cheating on quota by having customers return orders after sale?
- do marketing campaigns really drive product sales? does this vary by region and customer segments?
These questions were either answered in Tableau in side-by-side charts or by giving them to data science teams. It just isn't possible because they don’t join cleanly and they aren’t shaped the same way needed for unions.
And now composable data sources take that one step further.
Phase 7: Composable Data Sources (Tableau 2026.2 - June 2026?)
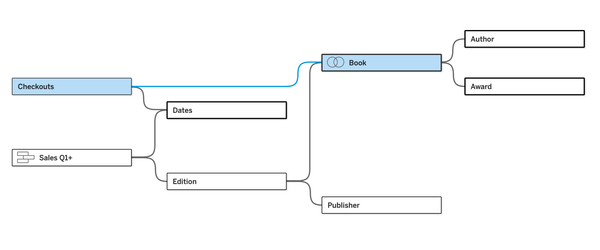
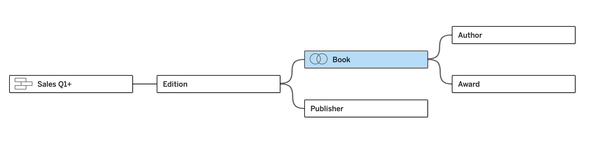
Finally. FINALLY. We can now (in beta) create relationships between published data sources. Published data sources are now building blocks and not endpoints.
This means we now have the flexibility we get with combining flat files in Tableau Desktop with the governance, security, reusability, and trust we expect from published data sources on Server/Cloud.
I am going to continue with a series of posts on the many use cases this enables. Stay tuned.
But just before that series, I want everyone to acknowledge that we are now going into...
The Unlearning Era
I think the hardest part of composable architecture is not technical. It is psychological.
We have spent years teaching people:
- certify the source
- lock down the source
- govern the source
- connect to the source
Now we have to teach differently:
- trusted does not mean static
- reusable should not mean untouchable
- a certified source is not the end of the story, it could be a beginning, middle, or end
- published data sources are now a building block inside a larger architecture
That is a major mindset shift.
Why This Matters
Most enterprise Tableau environments eventually hit the same wall.
You end up with:
- one published data source for finance
- another for sales
- another for support
- another for supply chain
- another for digital analytics
Every one of them governed and useful, but they have also been isolated from each other.
Then business wants to ask questions that cross domains:
- Do support issues impact renewal rates?
- Does inventory availability affect conversion?
- How does staffing influence customer satisfaction?
- What happens to returns after promotional campaigns?
Even with multi-fact relationships, answering those questions meant forking existing published data sources or creating new ones. Either way, it ends up with an explosion of published data sources. As this explosion happens it feeds on itself. If I don't know which one to use, I should just create another one I trust.
Composable data sources change that conversation.
Now trusted semantic assets can become reusable building blocks that participate in larger models.
We move from "replacing" to "extending". This is the architectural unlock.
More to come!