Build a Tableau Data App using Claude
Disclaimer: Most of my posts are written as "follow alongs". This one isn't. At the time of publishing, it is not a smooth experience to use Claude + publish to Tableau unless you are experienced in both Claude Code (which I used - not Claude Chat) and the way Tableau Cloud is administered, including understanding the REST API. Tim Ngwena does a great job of explaining how good Tableau data apps, but the experience of publishing them is far from great right now. I'm intentionally skipping this part for this post because I expect it will get better in short order and my goal is the focus on what data apps are, why I think they are better, and the best way to create them. Also, a new version of Tableau Desktop (referred to as Studio during the Dreamforce keynote) is dropping soon. You can also create data apps through it, but that would be another post. This post is specifically using Claude Code to create and publish a data app - no Tableau client software involved. I'm also using the Tableau plug-in that really helps Claude with this process.
Less than two months ago I wrote a post about using Tableau's hosted Cloud MCP to making it more accurate, less chatty, and more useful. It is amazing how many tools have been added since then. Today, I'm going to talk about using it to create data apps.
What is a data app? In the context of Tableau today, we are talking about an HTML dashboard as a new type of Tableau viz extension. This new extension is significantly different. It adds query though Tableau VizQL Data Service (instead of in-memory data at a sheet level) and it can have many charts on the same sheet, allowing for a lot of interactivity. It is more like a dashboard extension, where a viz extension is a sheet extension.
The other new feature which is really key is that Tableau automatically hosts the extension for you! No more external hosting. The one thing the new extension doesn't have, at least at the time of writing and as far as I can tell, is a usable marks card.
Before we start, I highly recommend that you don't try to build a dashboard by "chatting" with Claude. Instead, build a set of instructions for your dashboard and ask Claude to turn it into a "recipe" markdown file. Then, build your dashboard with a single prompt. You can also ask Claude to use your recipe file along with other markdown files for corporate standards and visual best practices.
Let's jump in! We are going to start by using the most popular YouTube video on Andy Kriebel's channel: Make an AWESOME Dashboard in 10 Minutes. Big thanks to Andy for giving me permission to use this video and dashboard!
Why pick this dashboard? In addition to most people having the context, Andy does such a great job describing what he is doing, his script is going to be a perfect starting point for our recipe. The point of this is definitely not to rip off someone else's dashboard; it is that a well-described dashboard can be built with a single prompt. Much better than "chatting" your way to a dashboard.
What I did next:
- downloaded Andy's video and ran it through MacWhisper to get the transript
- asked Claude to turn the script into a markdown (MD) file to act as a recipe
- downloaded his workbook and published the data source as a published data source on Tableau Cloud in a project called "Andy K"
This last step is important. Data apps need to use data sources on Tableau Cloud (and soon Server)... either published data sources or data sources embedded in workbooks. This means you get governance, row-level security, the possibility of federated query, the ability to use Hyper (so no consumption charges).
Here is what Andy's dashboard looks like:
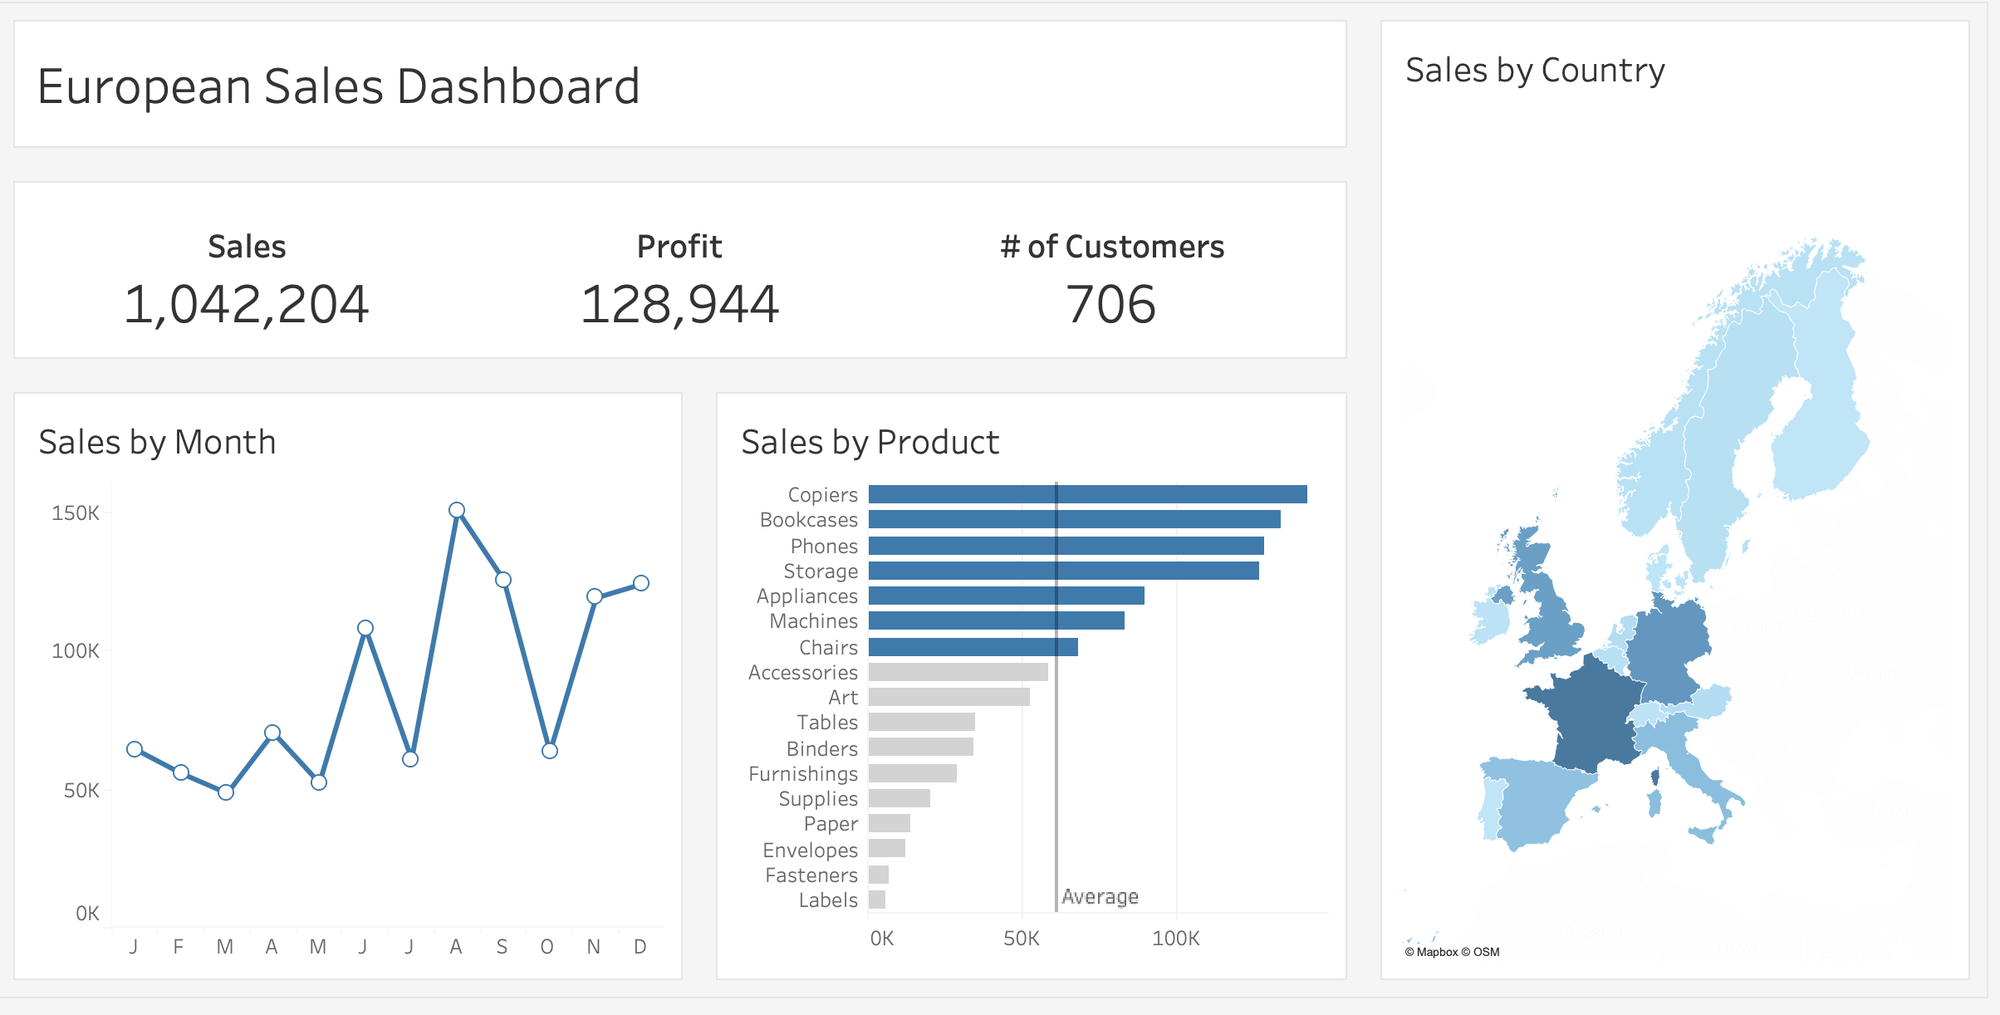
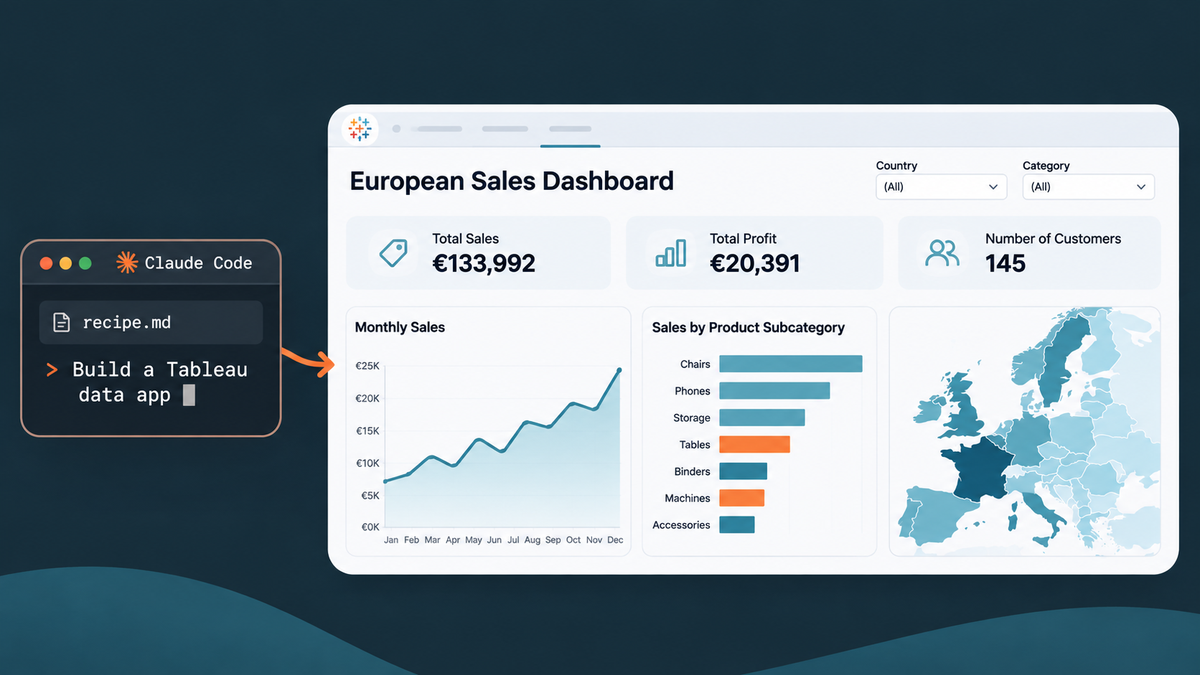
Here is the prompt I gave Claude Code and what it produced (and I added my recipe.md file as the "recipe" and fighting back adding "please" because I am Canadian):
Using this recipe file, can you create me a Tableau data app. The data source can be found in the Andy K project. When you are finished, publish to the same project.
Here is what it produced - in Tableau:
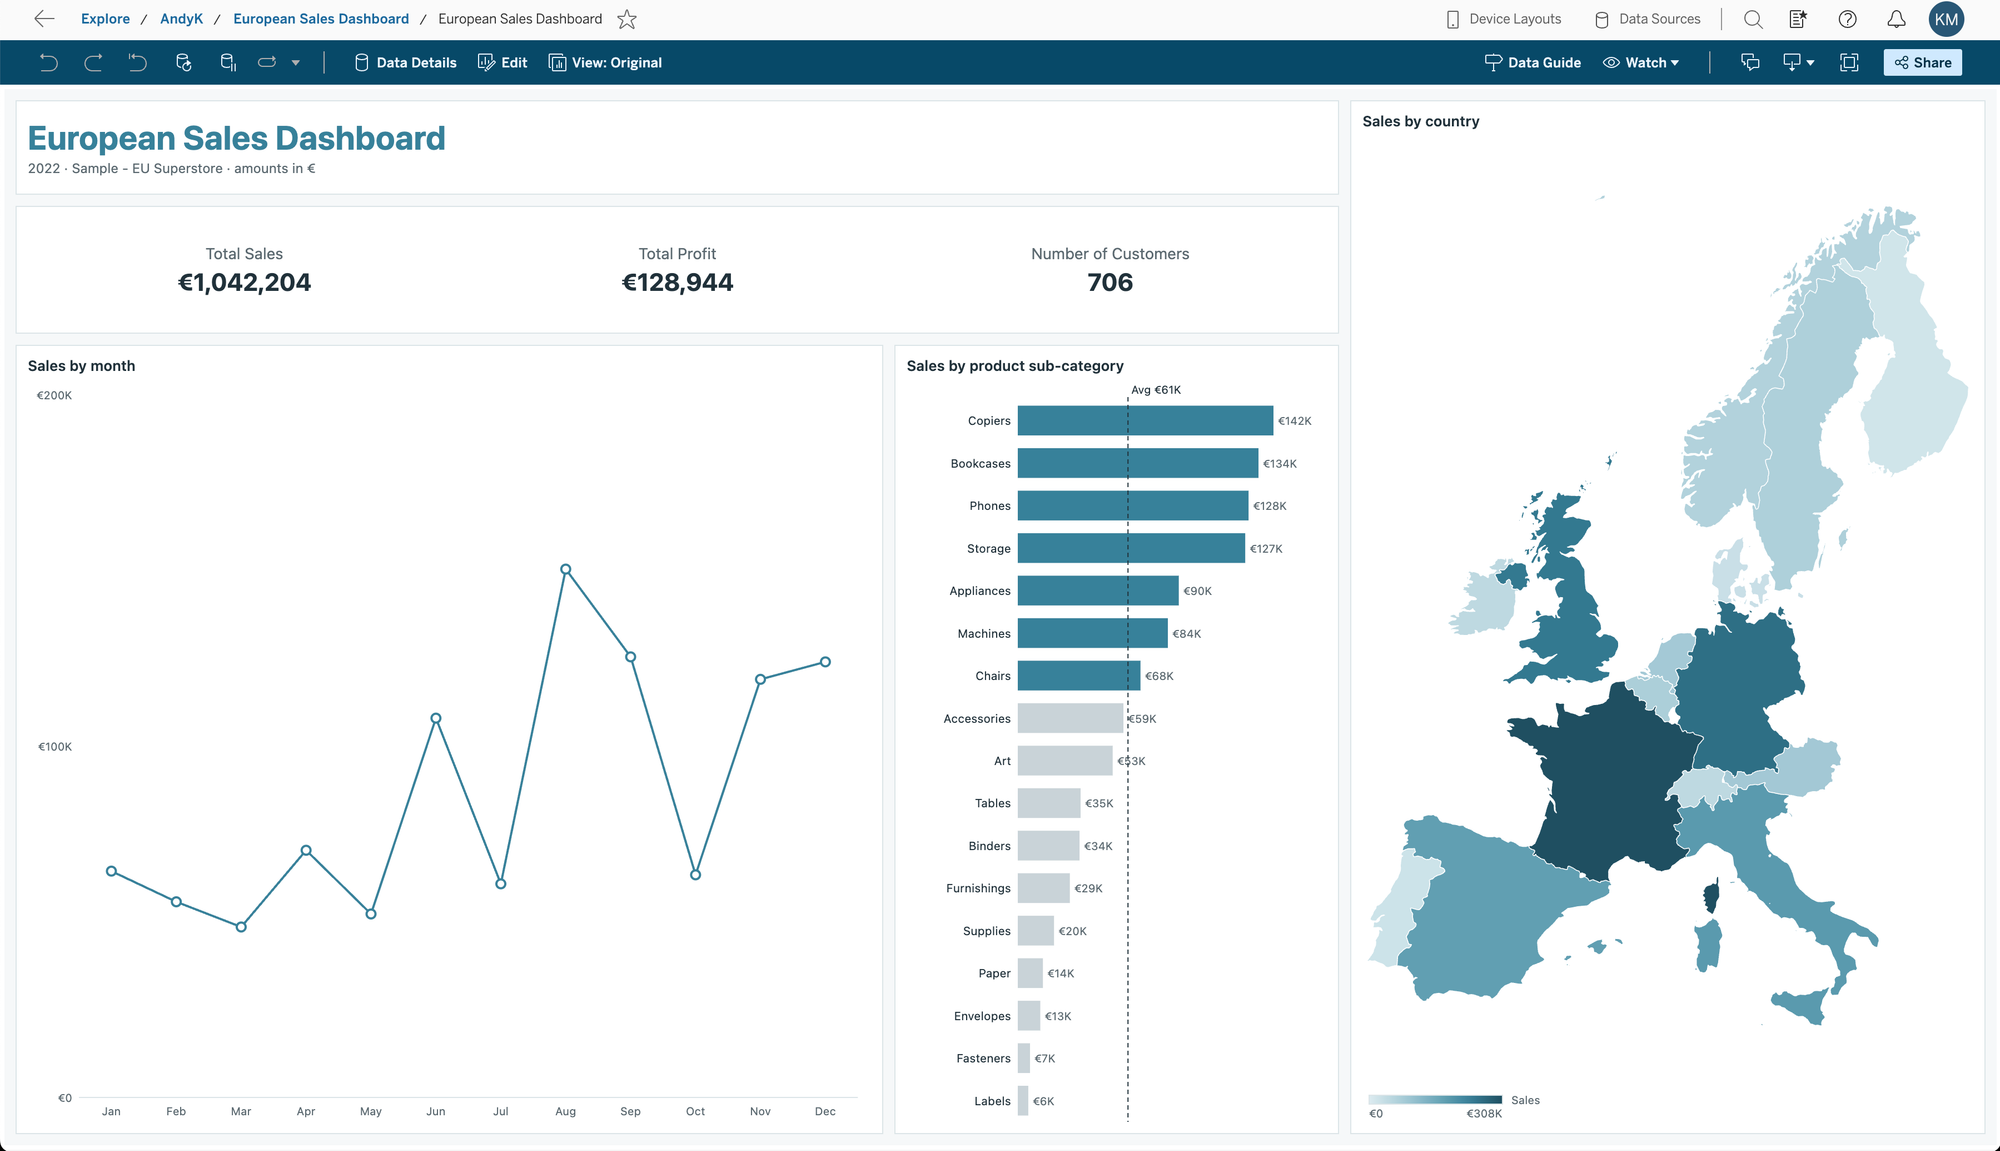
Not bad! And all of Andy's filter actions. Numbers match. Claude is keen though:
The European Sales Dashboard is published to the AndyK project: open it in Tableau. I haven’t seen it render. A data app only runs inside Tableau, so open it and check the layout and clicks before relying on it. Tableau may show a one-time prompt to trust the extension on first load.
It queries Sample - EU Superstore live and filters every query to the latest Order Date year, which is 2022. Fields used:
Sub-Category: product sub-category.
Country/Region: country.
Sales, Profit, Customer ID: SUM of Sales, SUM of Profit, and distinct count of Customer ID.
What’s in it:
Layout: the title and clear button, a KPI row (Total Sales, Total Profit, Number of Customers), and Sales by Month beside Sales by Product, all on the left. Sales by Country is on the right at about 33% width. The background is light gray and each component is a white card.
Sales by Month: line plus circles (white fill, blue border), three-letter month labels, no gridlines.
Sales by Product: sorted horizontal bars with a dashed average line. Bars at or above average are blue, the rest light gray.
Sales by Country: a filled choropleth map. I drew only the 15 countries in the data from the Natural Earth 50m boundaries, and dropped overseas territories like the Canaries and Svalbard. It has a Lambert conformal projection, white borders and a low-to-high legend.
Cross-filtering: clicking a month, sub-category or country filters the other charts and the KPIs, but never its own chart. Clicking the same mark again clears it, and a “Clear selection” button resets everything.
Differences from the recipe:
Currency: amounts are labelled in € because the data source doesn’t state a currency. Tell me if that’s wrong.
Size: the app fills the width and height of the Tableau window (600 px minimum) instead of being fixed at 1200 × 600.
Map colours: the map ramp uses a square-root scale so smaller countries stay distinguishable. France is about 100 times Denmark.
Brand colour: the title and bars use your brand blue #388099.
Not done: I haven’t checked the numbers against the data source or tested the month, sub-category and country clicks. The skill says to do that visual review after publishing, so I can iterate once you’ve looked at it.
I also didn’t use the “Sales above avg” calculation that already exists in the data source. The app computes the average across the displayed sub-categories itself.
Some of these are helpful, like the euro symbol! Some are questionable, like the dashboard size. I also don't like the spacing of the line chart vs the bar chart. I also would like to apply Paint with Data corporate style guide, so I gave this prompt:
Can we update this dashboard with the Paint with Data corporate standard that I attached. Also, set the dashboard back to 1200 x 600. Give the line chart and bar chart the same width. Add some tooltips and republish over the last one.
Let's see what Claude came up with:
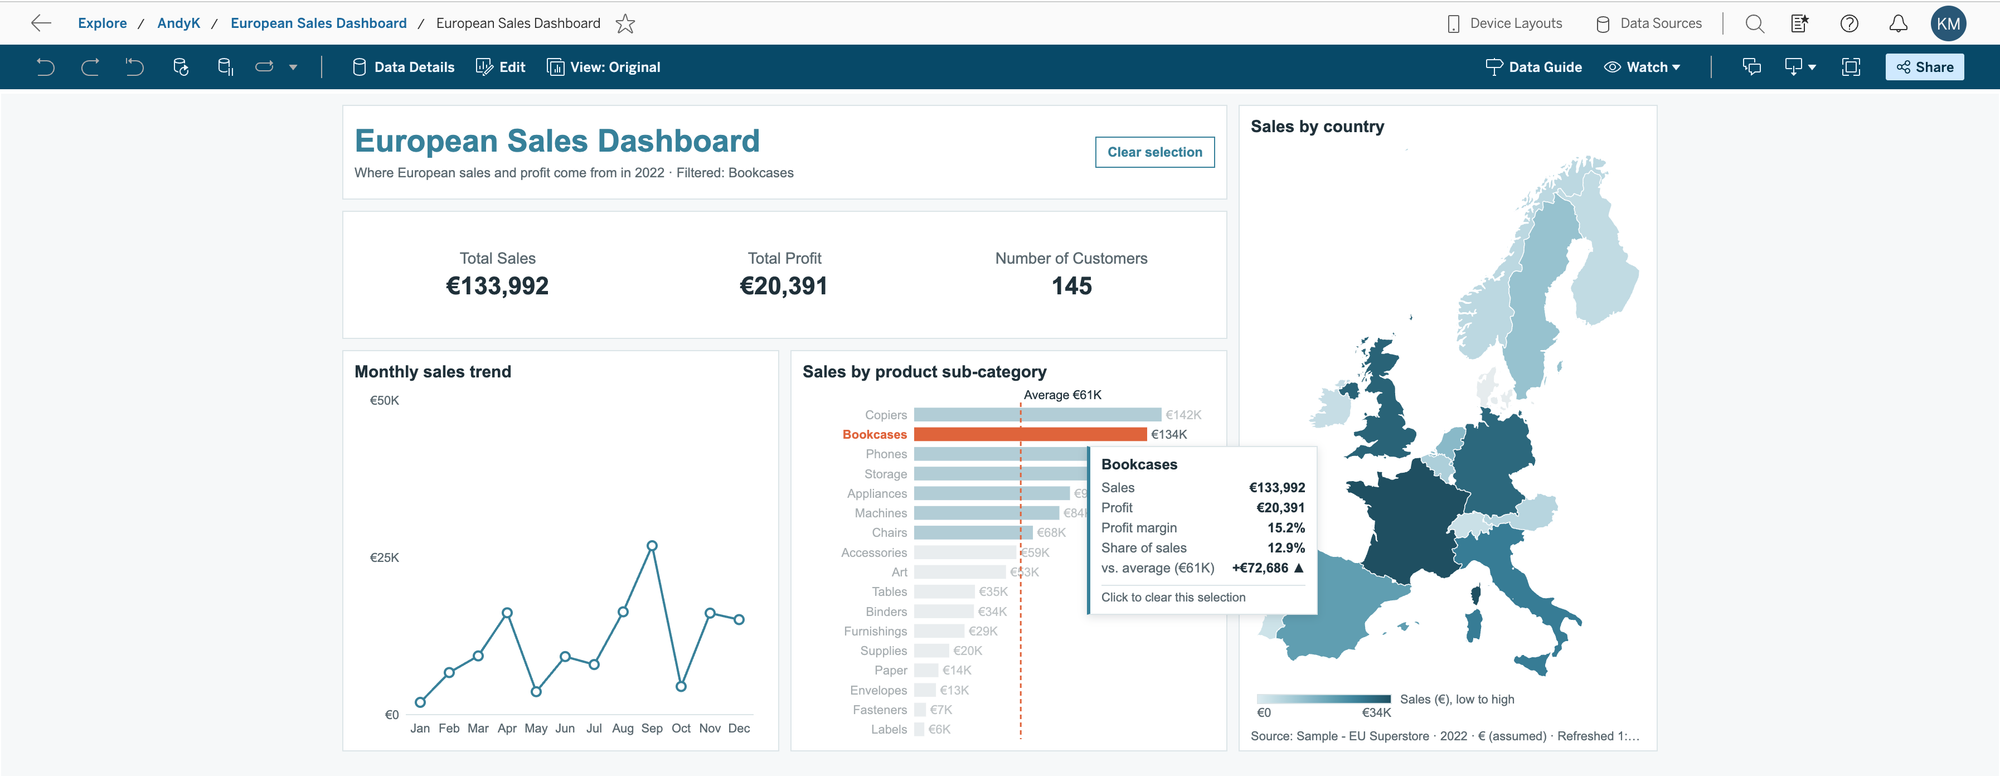
Pretty close! And try to do that highlight of the dimension member name in Tableau natively!
Last test. Since this supposed to be against a governed data source, let's see if it respects row-level security:
First, here is my entitlements table:
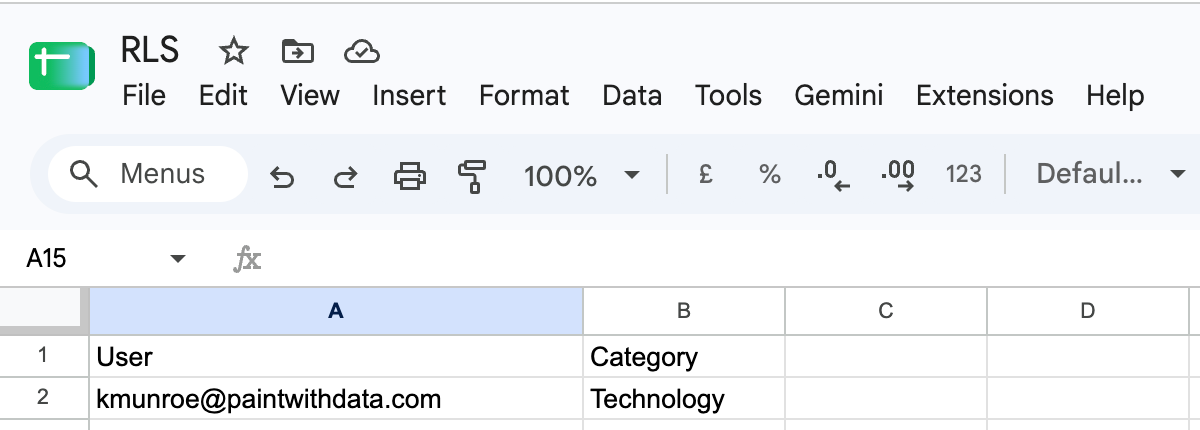
I add that into my data source, create a calculation, and set it to true on the database (all related tables):
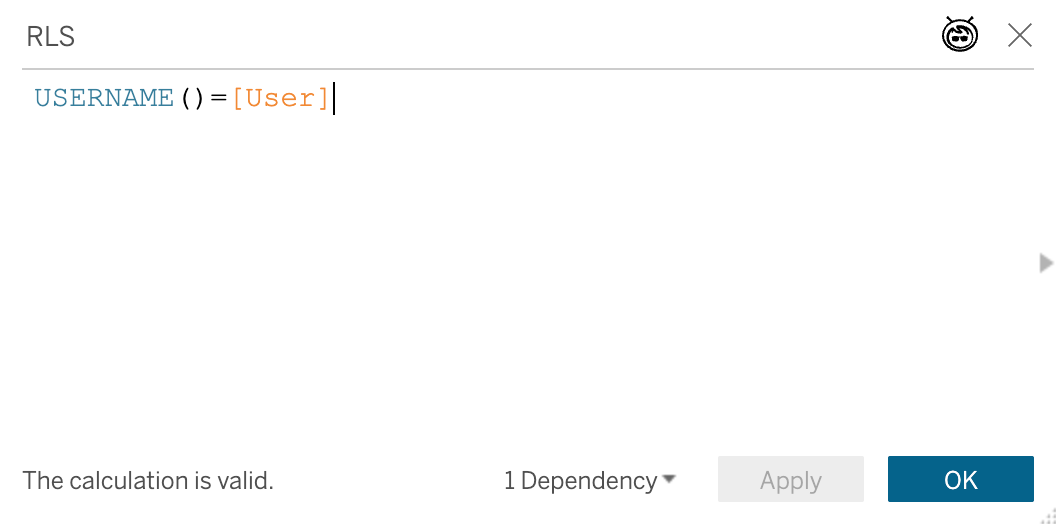
And.. boom! I can now only see data
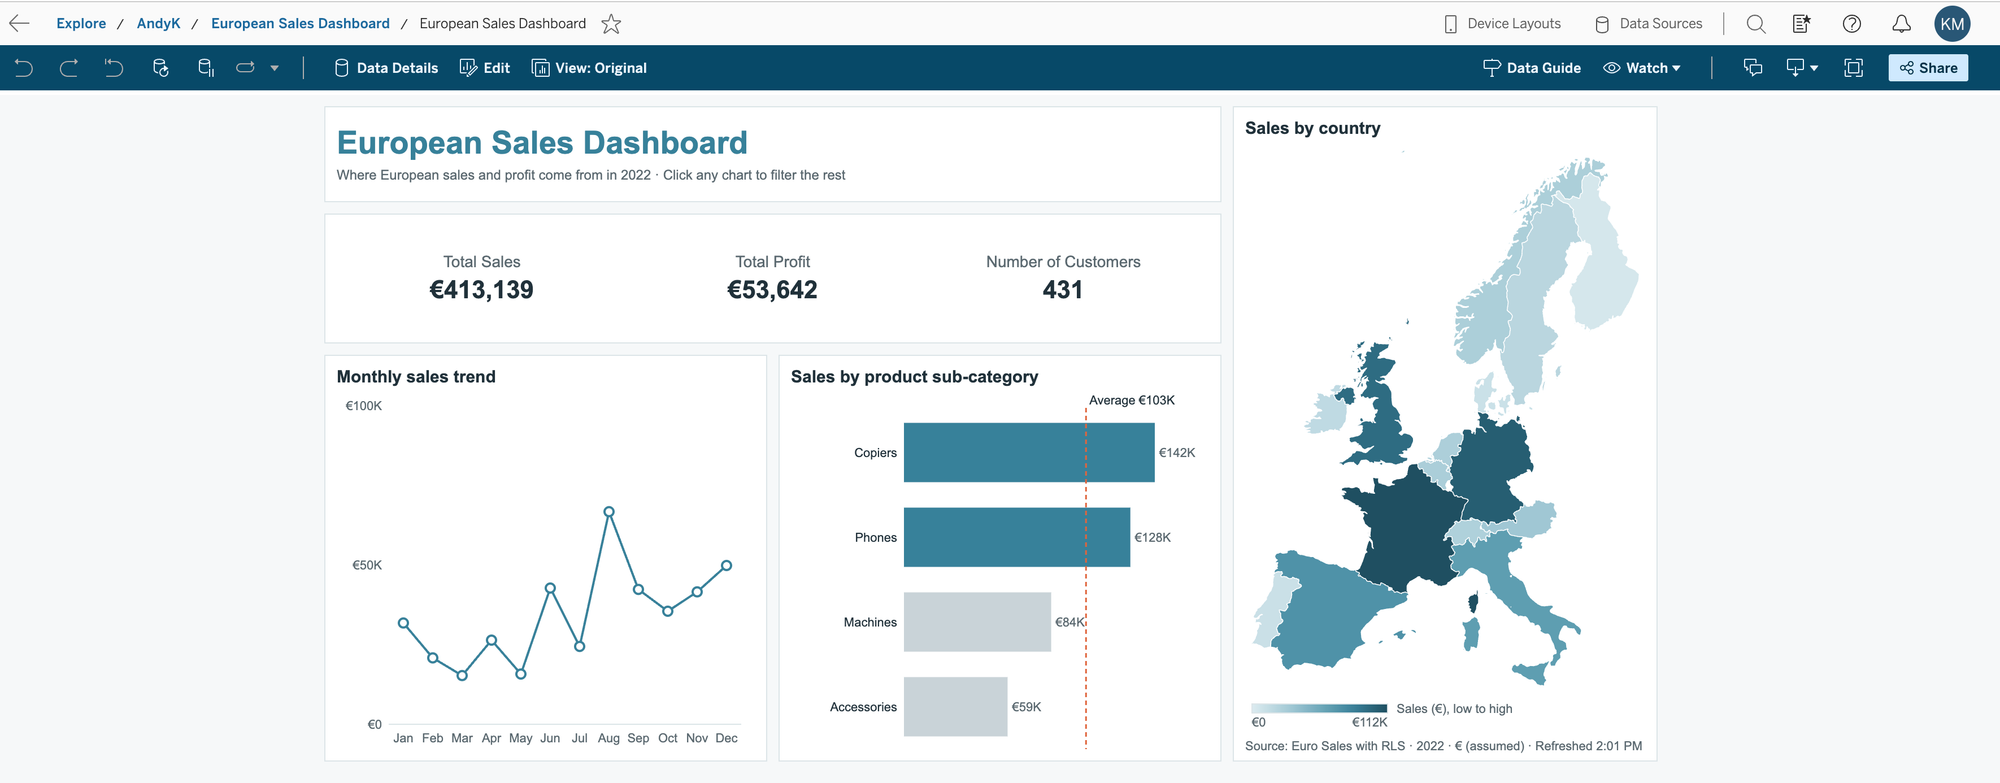
Last thing before closing this post. Here is what the workbook looks like in Edit mode (and presumably Desktop when it catches up):
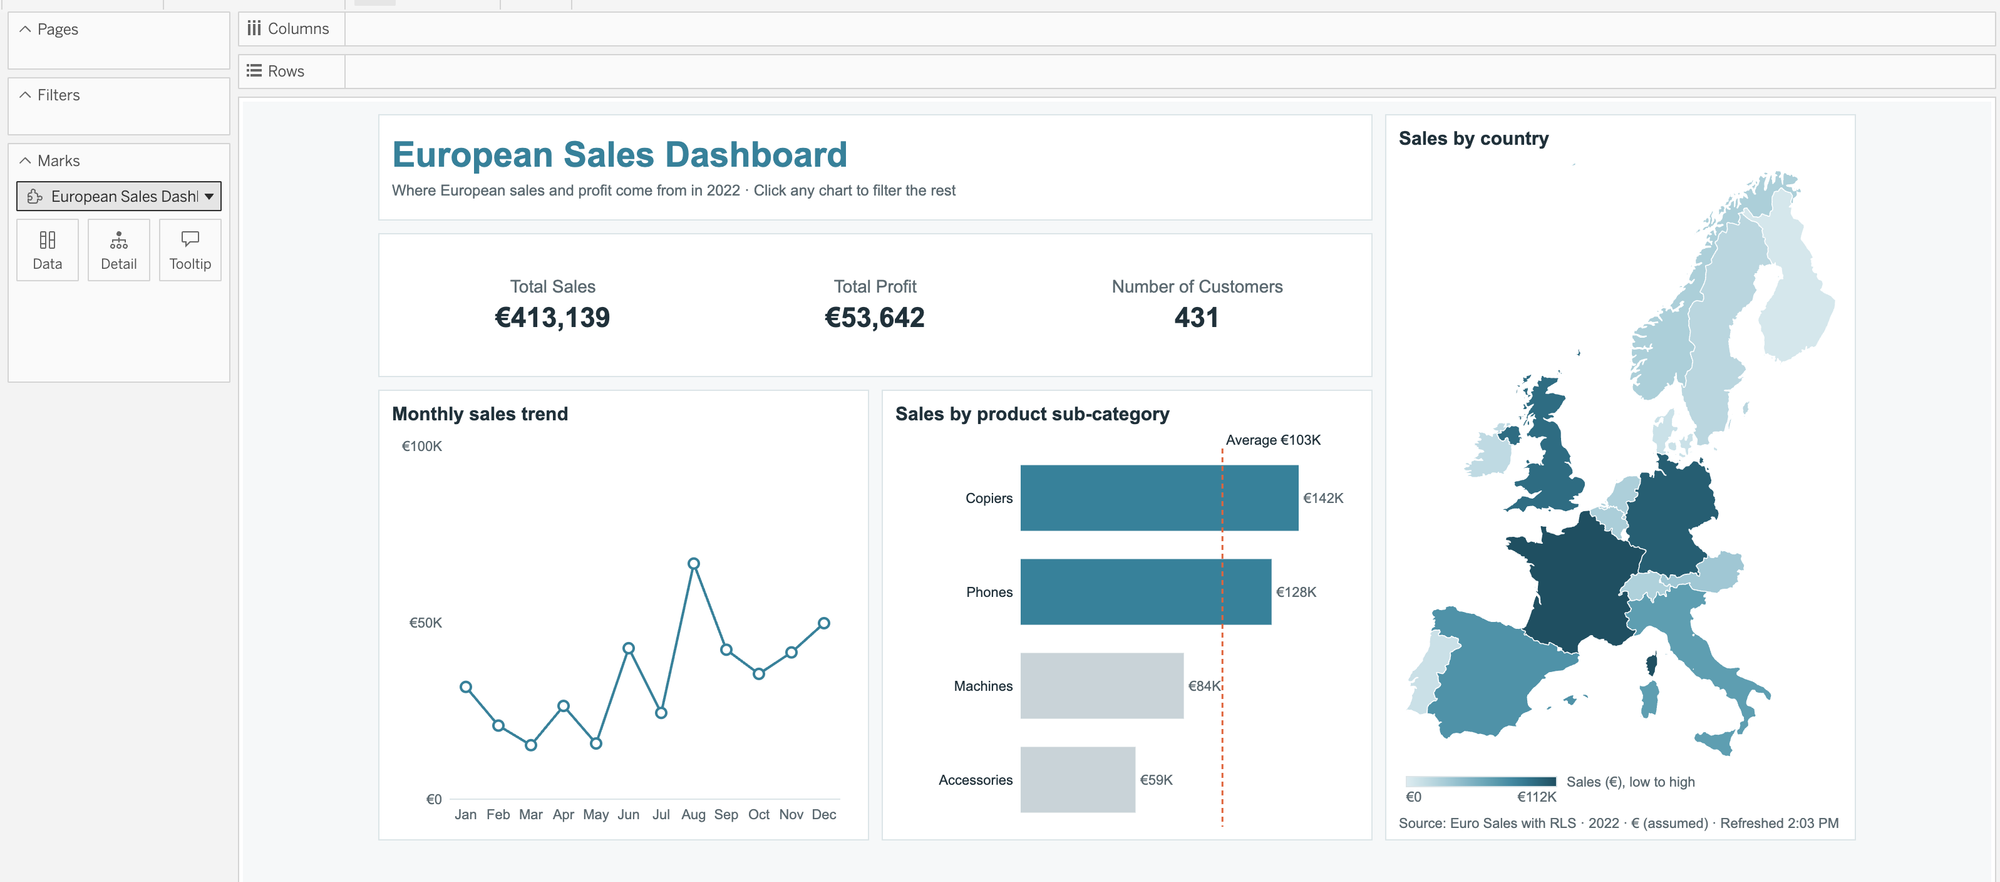
A single sheet viz extension that uses VizQL Data Service (VDS). Pretty cool! The marks cards are not useable at this time.
That is the overview. More to come soon!