Making Tableau’s MCP More Accurate, Less Chatty, and More Useful
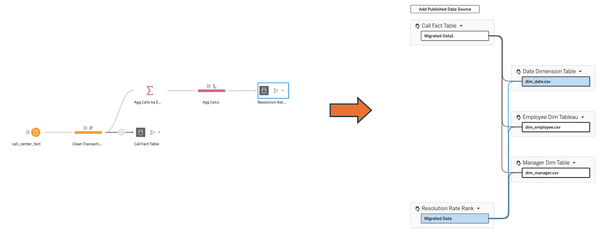
Tableau 2026.2 recently released, and it was loaded with important features. In my opinion, none was bigger than Composable Data Sources (now available in 2026.2.2).
But there were plenty of other really solid additions: drive time on maps, SVG downloads, the ability to edit Bridge data sources in the browser, and a Tableau Cloud-hosted MCP server.
MCP (Model Context Protocol) servers get a lot of both love and hate. As with most things, there’s some truth behind both perspectives.
The good: They give you programmatic access to APIs without requiring you to be a developer—or, if you are a developer, they can make you much more efficient.
The bad: They can be very “chatty,” which means more tokens, more latency, and potentially more cost. They’re also fairly blunt instruments when what we often want is a much more specialized tool.
But I think we can address a lot of the “bad” with some thoughtfulness—and without a lot of technical skill.
In this post, we’re going to look at how to set up Tableau and Claude so that people can ask questions of their Tableau data models more reliably, while reducing the amount of work Claude has to do to figure out what we mean.
First: Connect Claude to Tableau
If you’re intimidated by the idea of using Claude with Tableau, you needn’t be. You can download Claude Desktop and jump right in—you can even get started with a free account.
Assuming you have access to a Tableau Cloud site, open Claude Desktop and select Customize --> Connectors:
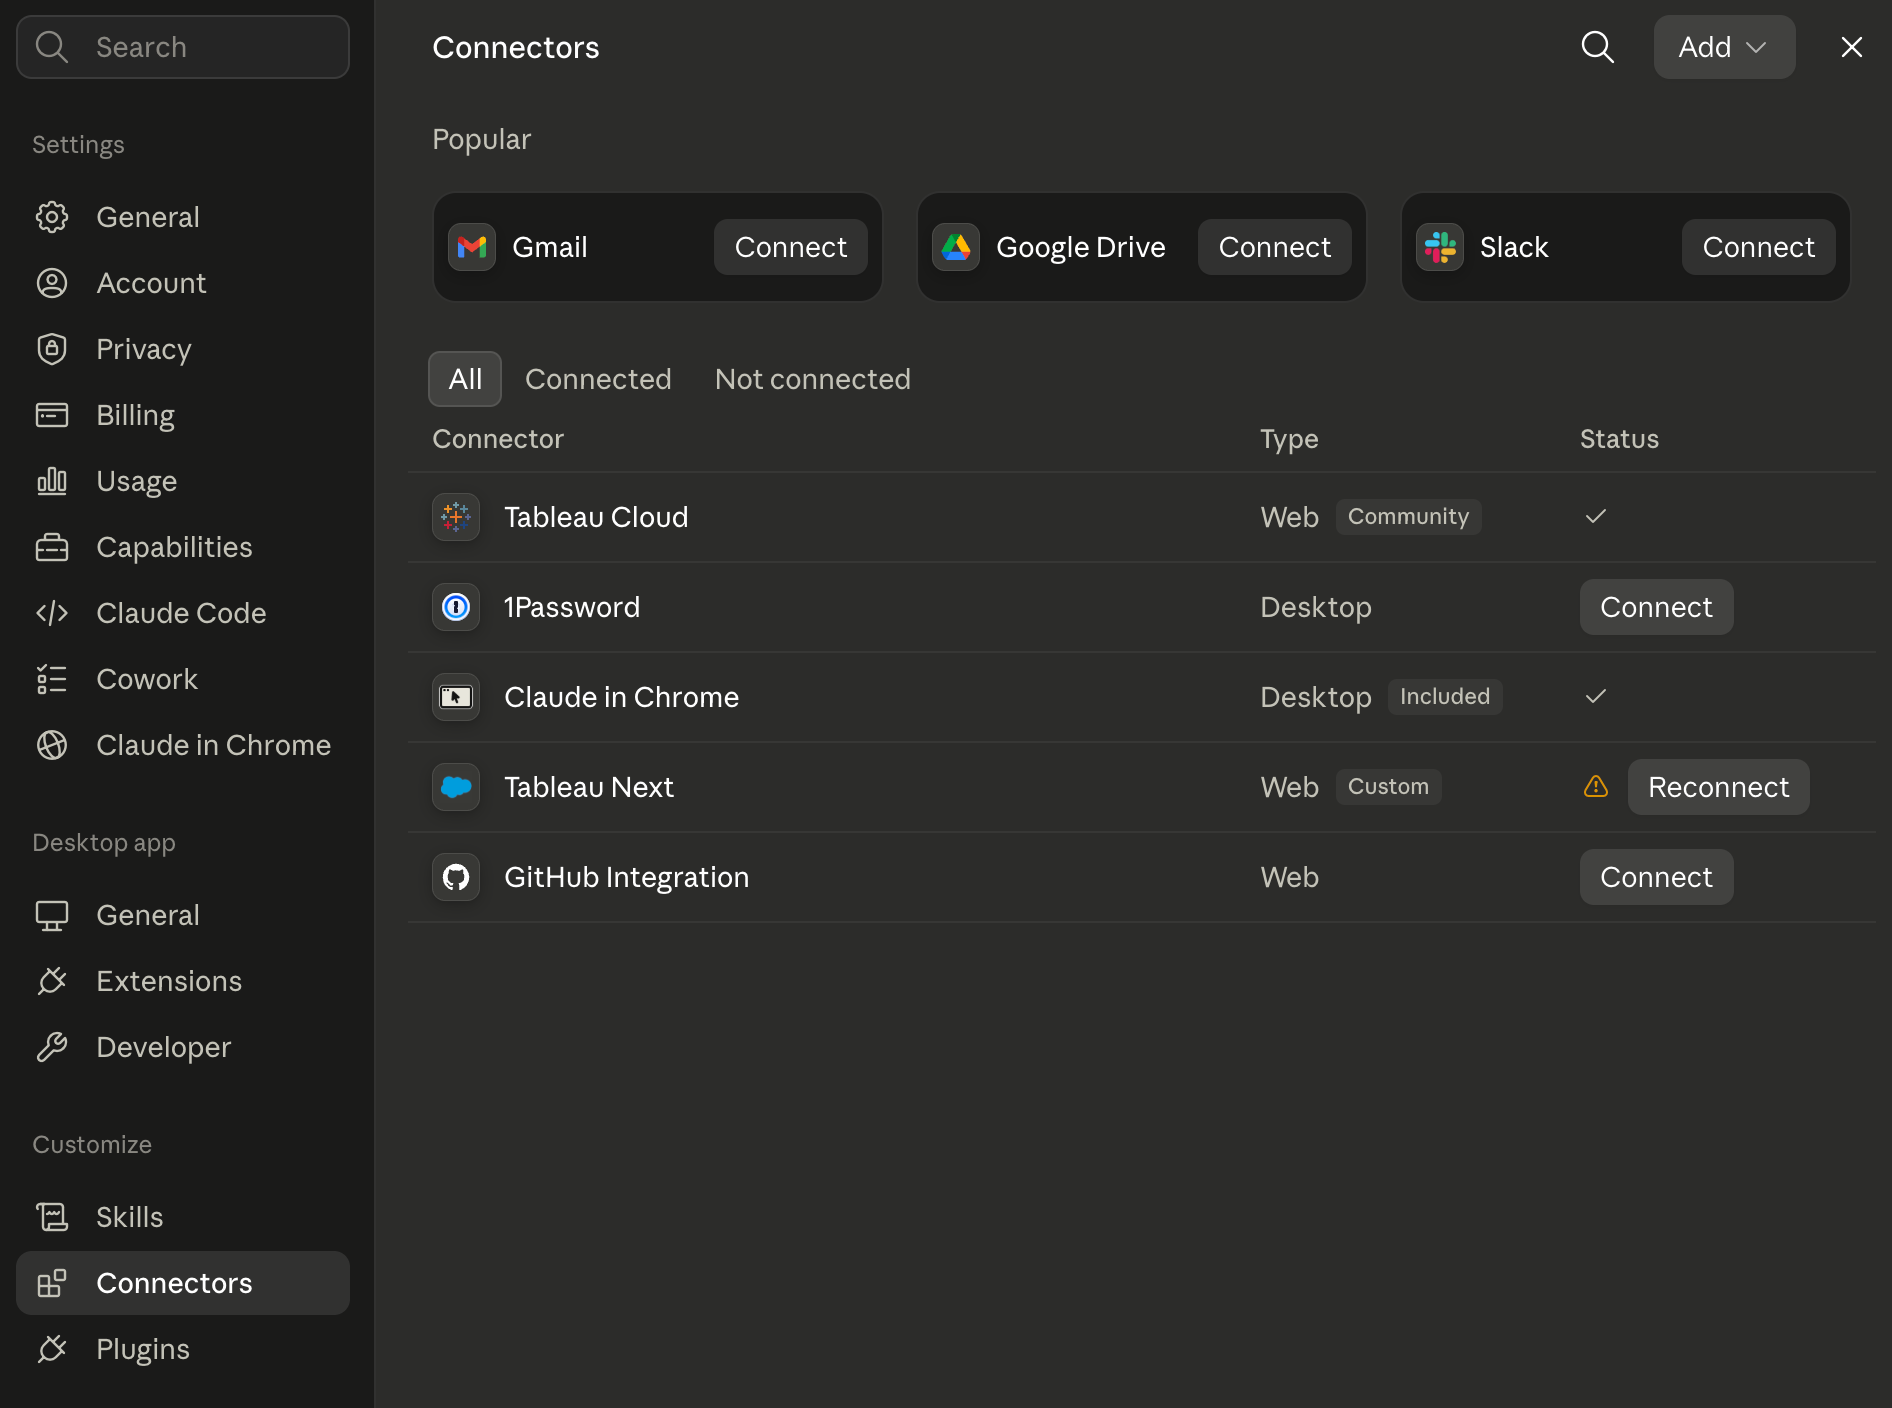
If you used the old Tableau MCP, you would have done this differently, so bear with me...
Add a custom connector. All you need to provide is a name and the Tableau MCP URL in the Remote MCP server URL field.
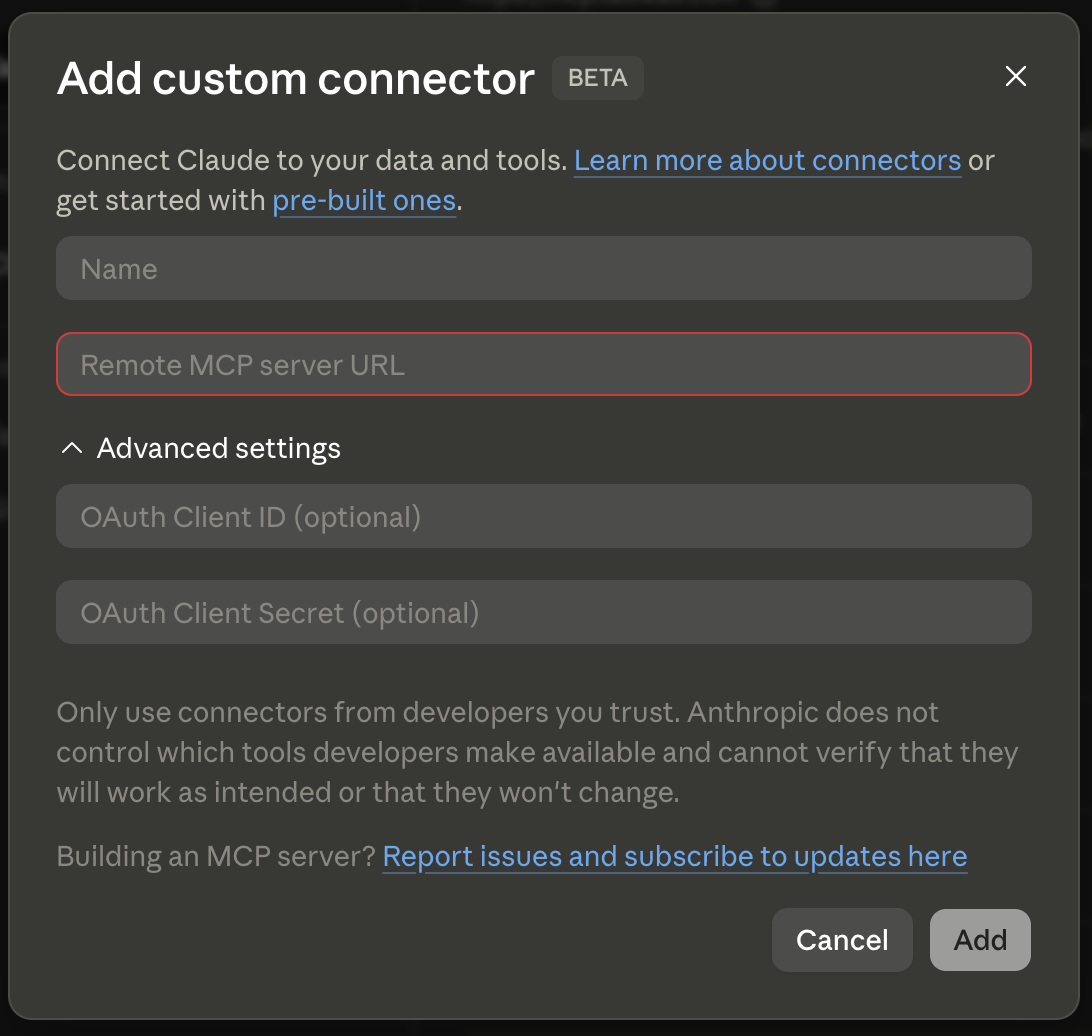
You’ll then be asked to sign in to your Tableau Cloud site.
Unlike the old Tableau MCP—which you had to get from GitHub and install yourself—the hosted version uses OAuth rather than personal access tokens. That’s a much easier experience, particularly if you eventually want less-technical users accessing it.
At this point, we could start asking questions of Tableau through Claude. However, I wouldn’t do this.
Before putting this in front of users, there are several things I’d do to increase the likelihood of accurate answers, reduce Claude’s “chattiness,” and potentially reduce the associated token costs.
1. Clean Up Your Data Model
The first step is simple: don’t make the LLM interpret things it doesn’t need to interpret.
Clean up field names, hide unnecessary fields, and create calculations for business logic you already understand.
Here’s part of my data model:
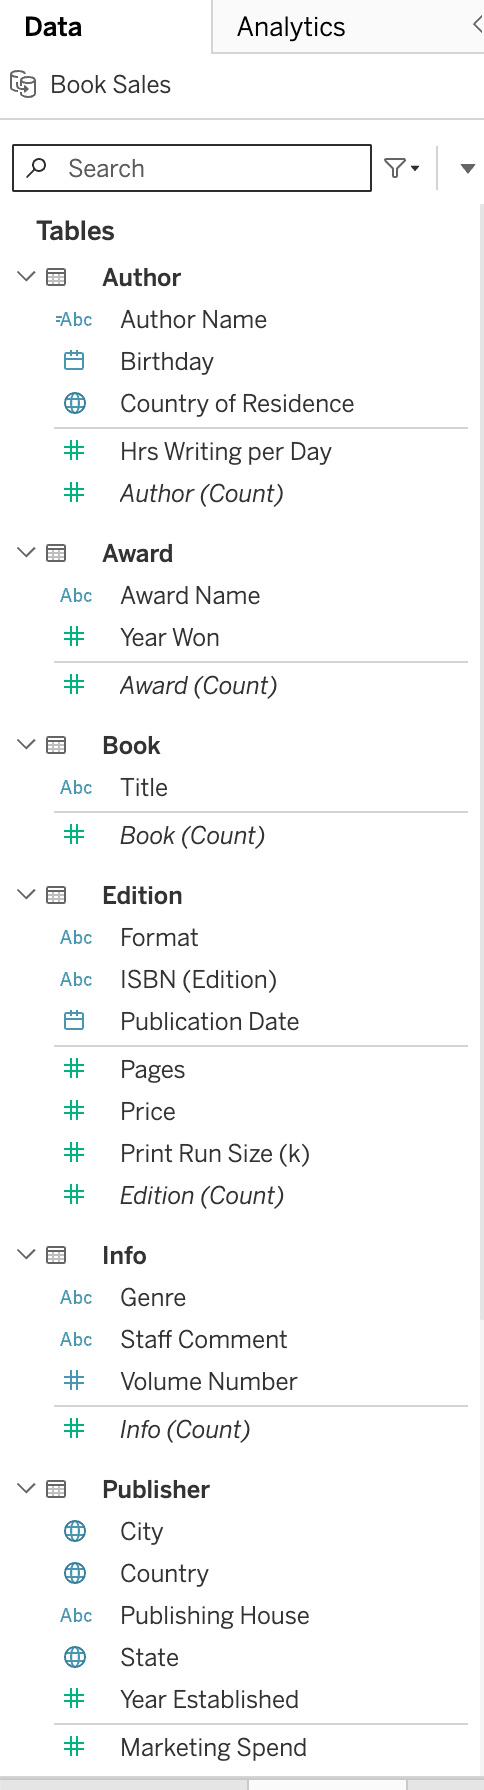
You’ll notice that I’ve hidden ID fields and other fields I don’t need to expose.
I also created calculations for things I don’t want Claude to have to figure out itself. For example:
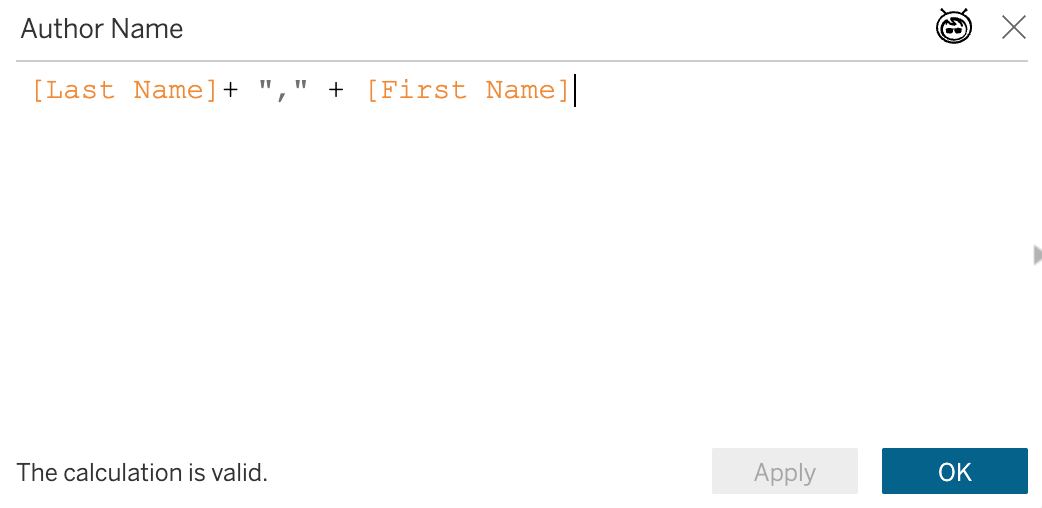
and:
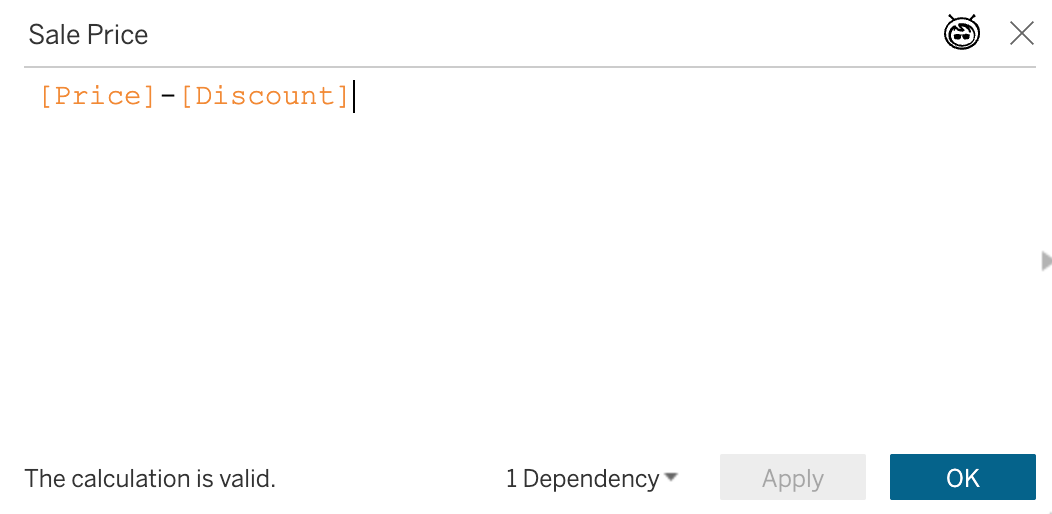
This is an important principle throughout this exercise:
If you already know the business logic, put it in the semantic layer rather than asking the LLM to rediscover it every time someone asks a question.
That should improve consistency, reduce unnecessary tool calls and calculations, and make the experience much more predictable for users.
2. Add Table Descriptions
The next thing I recommend is adding descriptions to your logical tables.
Every table should have a meaningful description.
Yes, this requires some upfront work. But it’s worth it if it prevents users from getting frustrated with incorrect answers—and potentially blaming you, Tableau, or the AI when the real problem is ambiguous metadata.
Here’s an example:
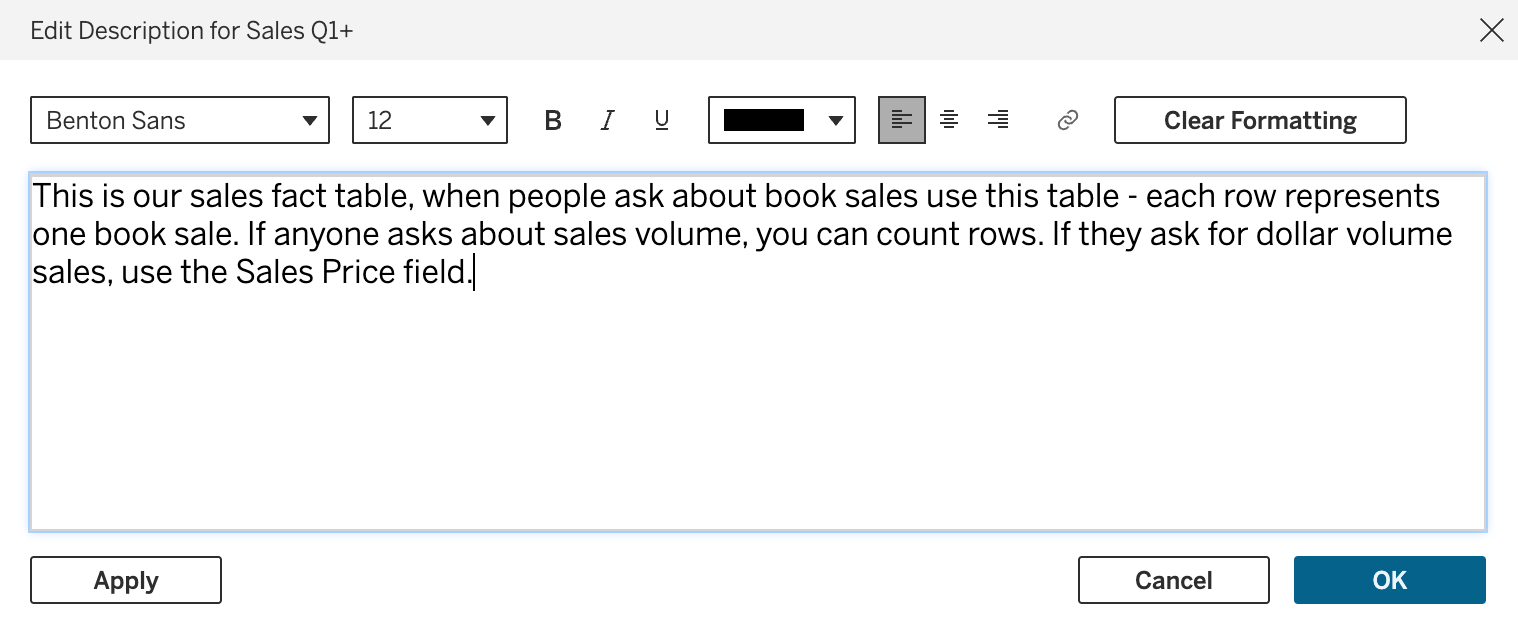
If you’re having trouble finding the description area, click any logical table on the canvas and it will appear:
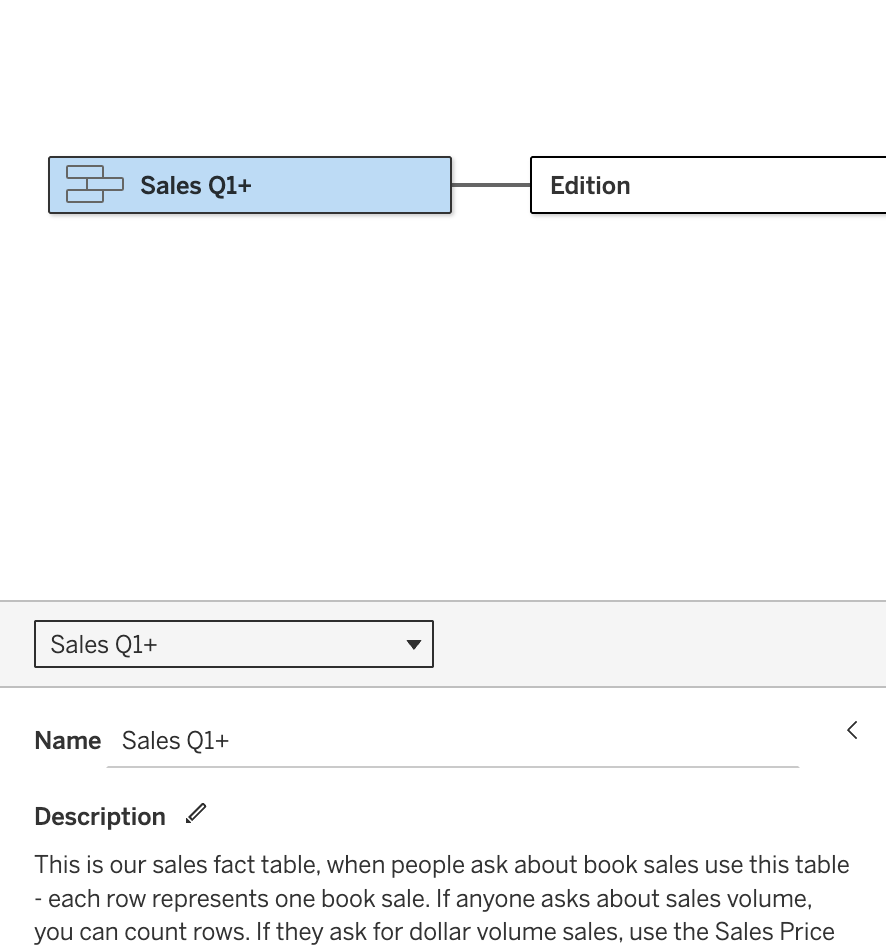
If this were a production environment, I’d do this for every relevant table in every published data source—and I’d put some thought into the descriptions rather than simply documenting the obvious.
The goal isn’t just documentation. The goal is to give the LLM enough semantic context to choose the right data.
3. Add Field Descriptions and Aliases
Next, make sure the important fields in your model have useful names, aliases, and descriptions. This helps disambiguate requests made through the LLM.
Without that context, Claude has to make its best guess. Sometimes that guess will be correct. Sometimes it won’t.
Here’s a real example.
I was working with a client in the transportation industry that has a metric called Cost Per Mile. In the data model, the calculated field is named CPM. Before adding a field description, I asked Claude for cost per mile. Claude spent some time creating its own calculation to answer the question.
When I asked why it hadn’t used the existing CPM field, it told me it had interpreted CPM as cost per thousand impressions. In hindsight, that’s not a surprising assumption at all.
I added a field description of “Cost Per Mile” to the CPM field, started a new conversation, and the problem disappeared.
There are two ways to update field descriptions.
In Tableau Desktop, right-click the field and select:
Default Properties → Comment
Then enter the description.
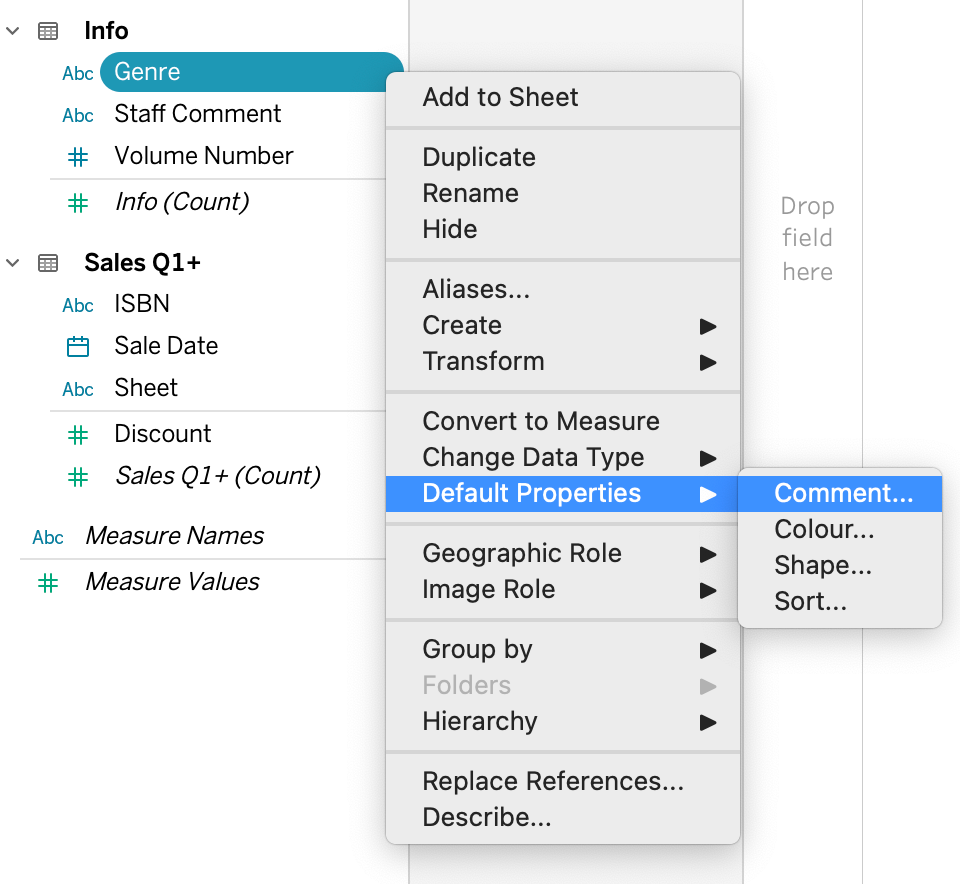
In Tableau Cloud, go to the data source’s Lineage tab. Assuming you have the appropriate permissions, you can select the field:
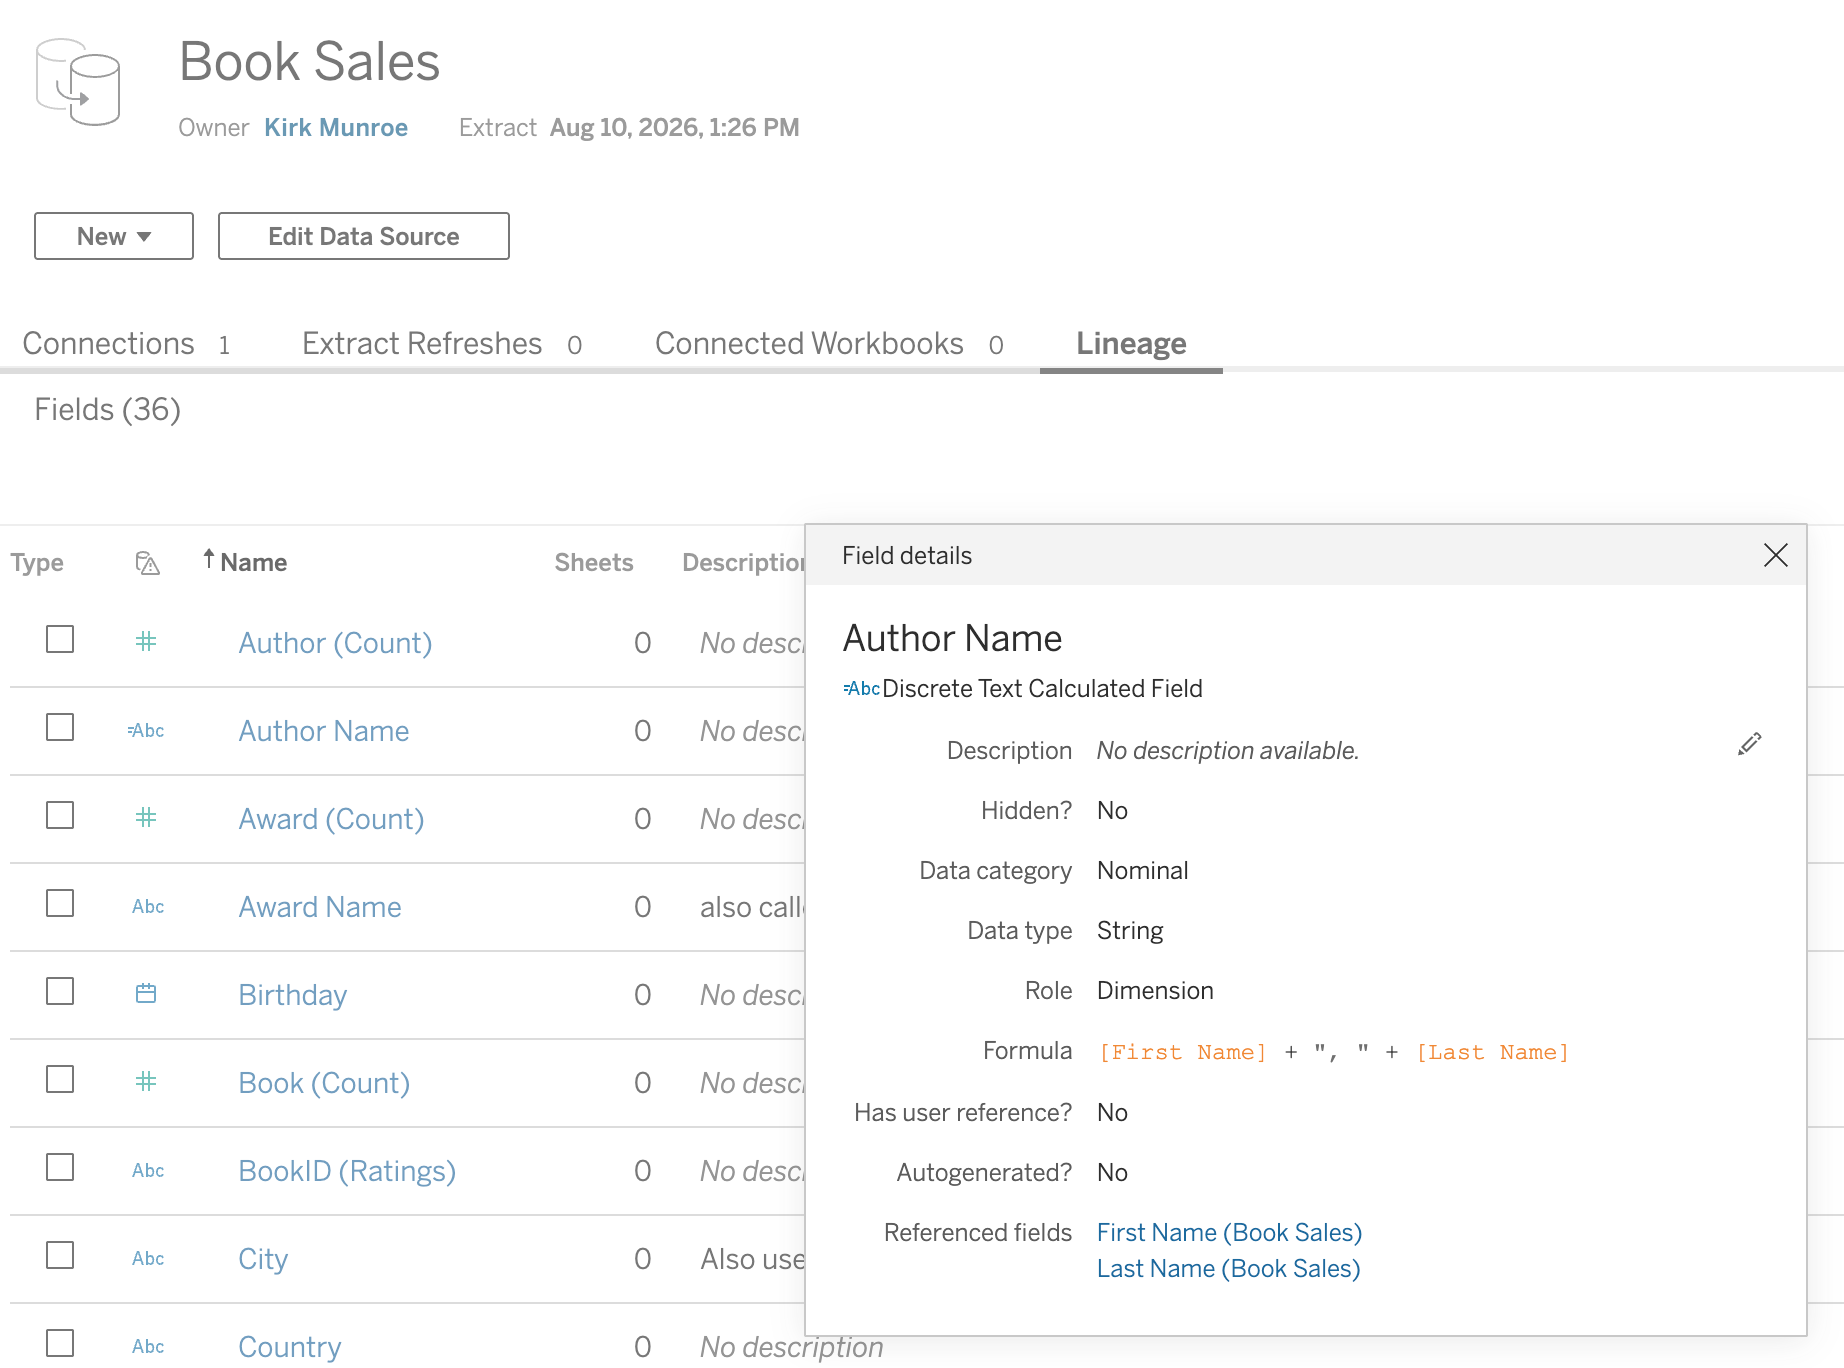
Then, edit description:
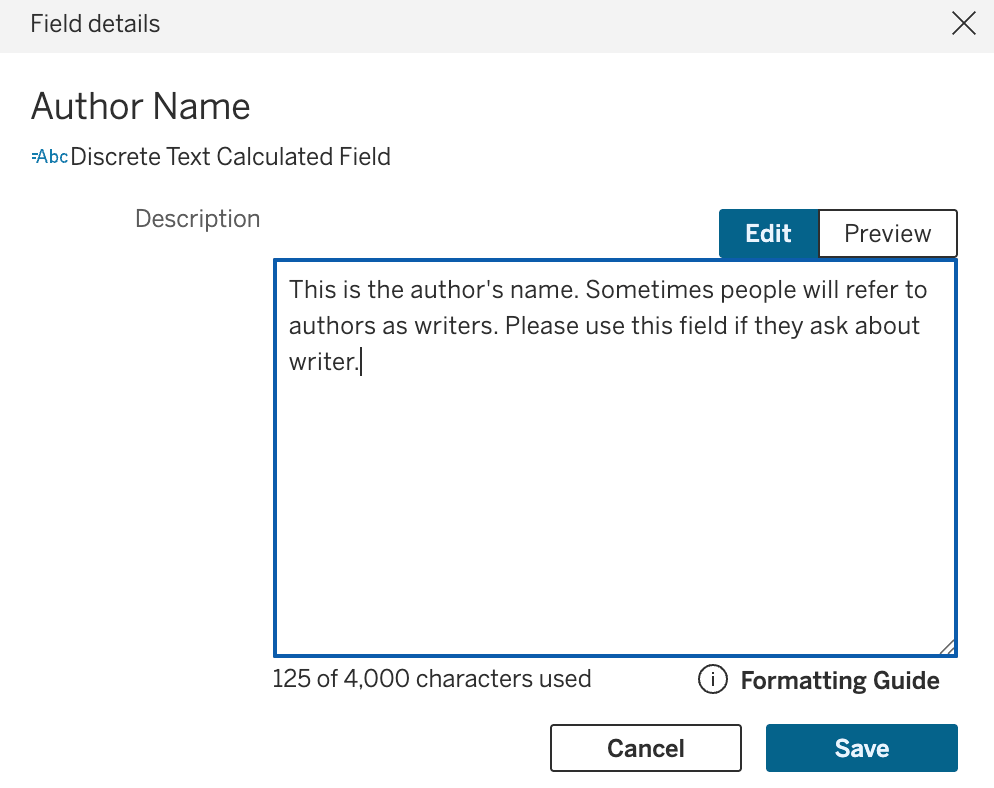
I’d do this for every field users are reasonably likely to ask about.
Again, we’re trying to move interpretation out of the LLM wherever possible and into a governed semantic layer.
4. Don’t Automatically Enable Every Tableau Tool
Just because Claude can access something doesn’t mean it should.
Here’s the list I’m using:
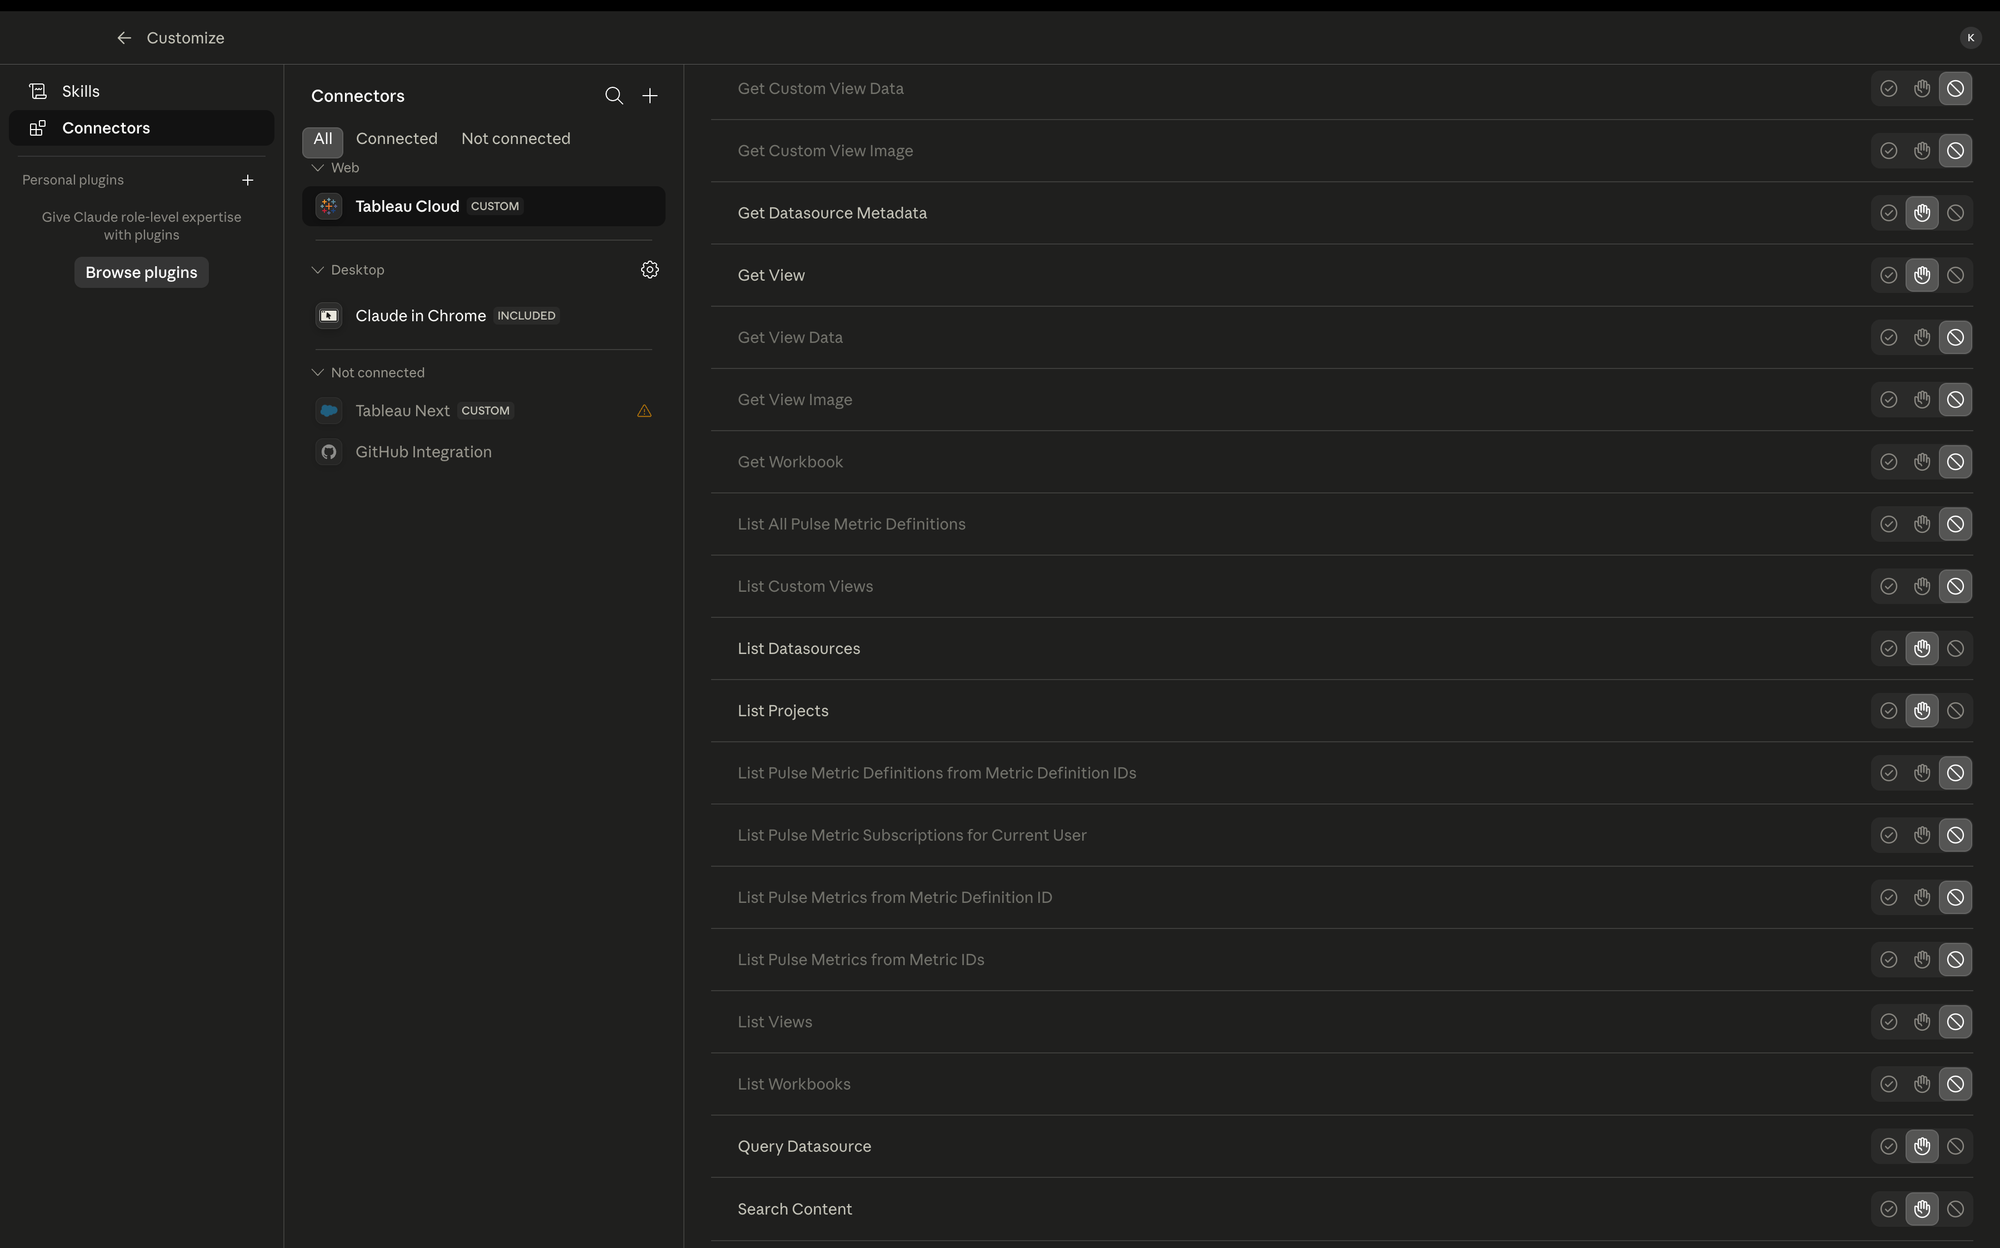
Maybe your use case requires querying workbooks or Pulse metrics. Mine doesn’t.
For this example, I want Claude answering analytical questions using published data sources.
Why? Because people may have created workbook calculations or Pulse metrics containing logic I haven’t validated. If Claude can freely choose among all of those assets, I’m giving it more ways to arrive at an answer—and potentially more ways to arrive at the wrong answer.
Where possible, I’d rather centralize trusted business logic in governed published data sources and point Claude there. This is as much a governance decision as it is an AI decision.
5. Create a skill file to direct questions properly
You can build skill files in Claude to do all sorts of things including which chart types to use. I like the use skill files to help with additional semantics - making sure Claude looks where I want it to in order to answer questions.
I asked Claude to create a skill file with this prompt:
Use this skill whenever the user asks about book sales — revenue, units sold, sales by genre or category, sales trends over time, top sellers, or any analysis touching the bookshop's sales numbers. Trigger even when the user doesn't say "Tableau" or name the datasource explicitly (e.g. "how did romance do last quarter", "book sales by category over time", "what's our best-selling genre"). This skill makes sure Claude pulls live numbers from the Tableau "Book Sales" datasource instead of guessing, using a stale uploaded file, or fabricating figures.
Then, when I save the skill, Claude responds with:
Saved as book-sales-data. Any future "book sales" question — by genre, over time, revenue, top sellers, whatever — will now always route to the live Tableau "Book Sales" datasource (in the Bookshop Sales project) rather than an uploaded file or guessed numbers, and it'll re-check the datasource metadata each time so field mappings like category→Genre and town→City stay current even if they change on the Tableau side.
Want me to test it on a couple of prompts to make sure it triggers and behaves the way you expect, or is this good as-is?
OK, ready to test! Let's ask:
Can you let me know how book sales have done by category and by month?
The response:
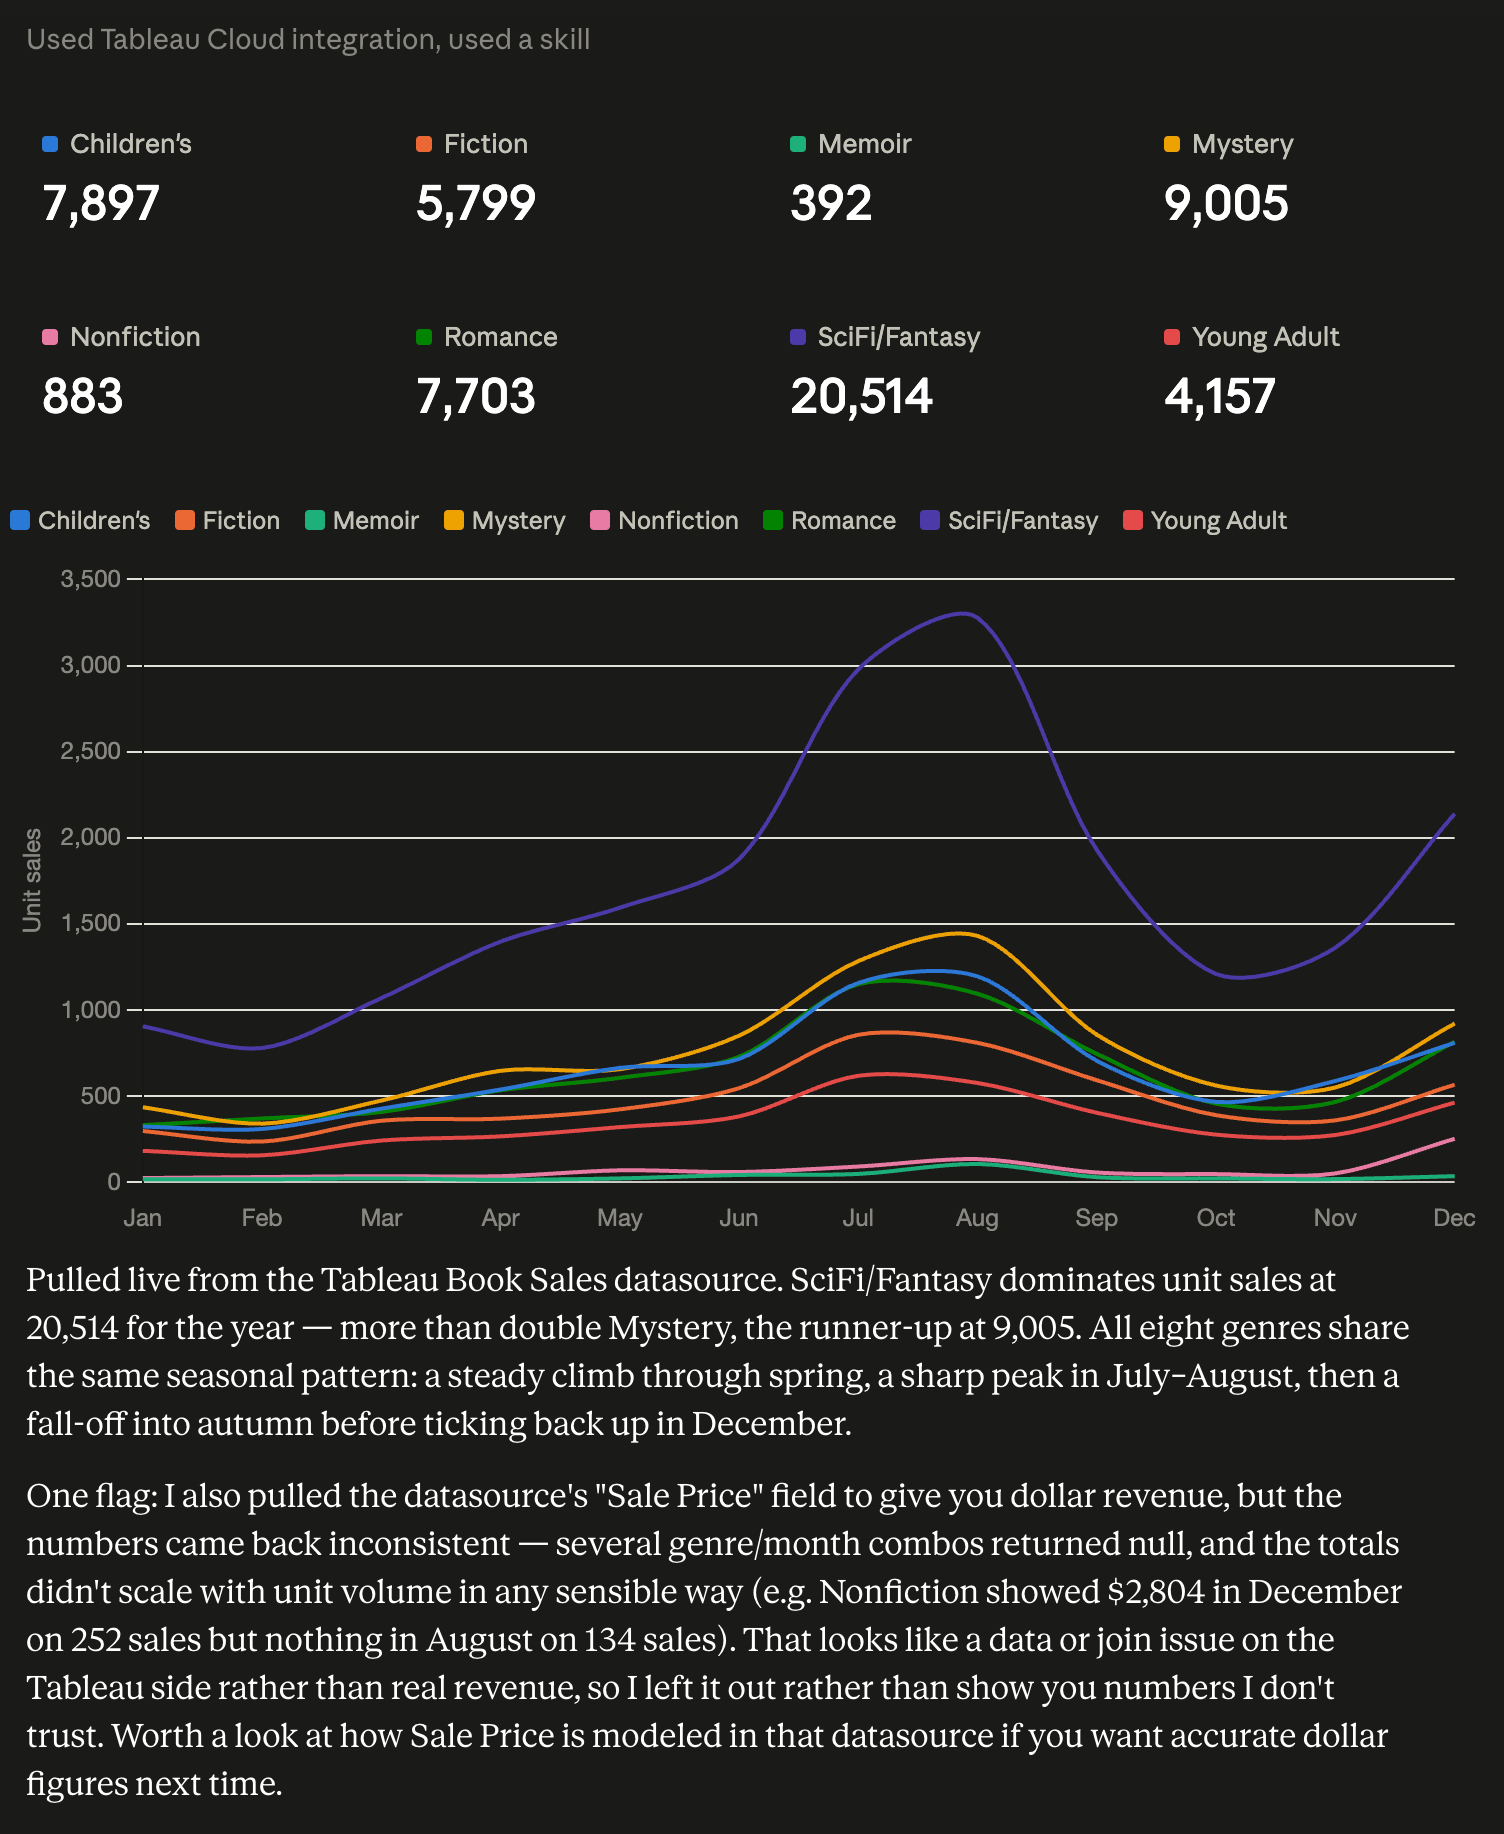
There’s something interesting here.
I didn’t specify whether I wanted revenue or volume. Claude chose volume—and explained why it didn’t use Sale Price.
That’s exactly the kind of behaviour I want to see. Rather than blindly making an assumption about an ambiguous metric, it surfaced its reasoning.
But this also exposed a problem in my model.
The failure is actually the interesting part!
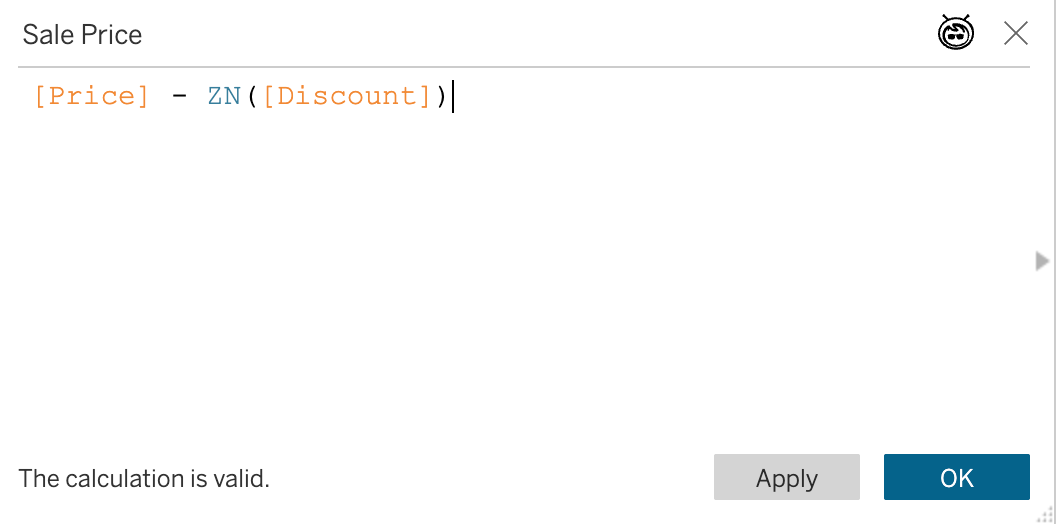
I suspected one of my calculations above was wrong.
So I fixed it and asked Claude:
Can you try to give me net revenue again for non-fiction? I fixed the calculation (I think). Can you give it to me monthly as a bar-in-bar comparing revenue to net revenue?
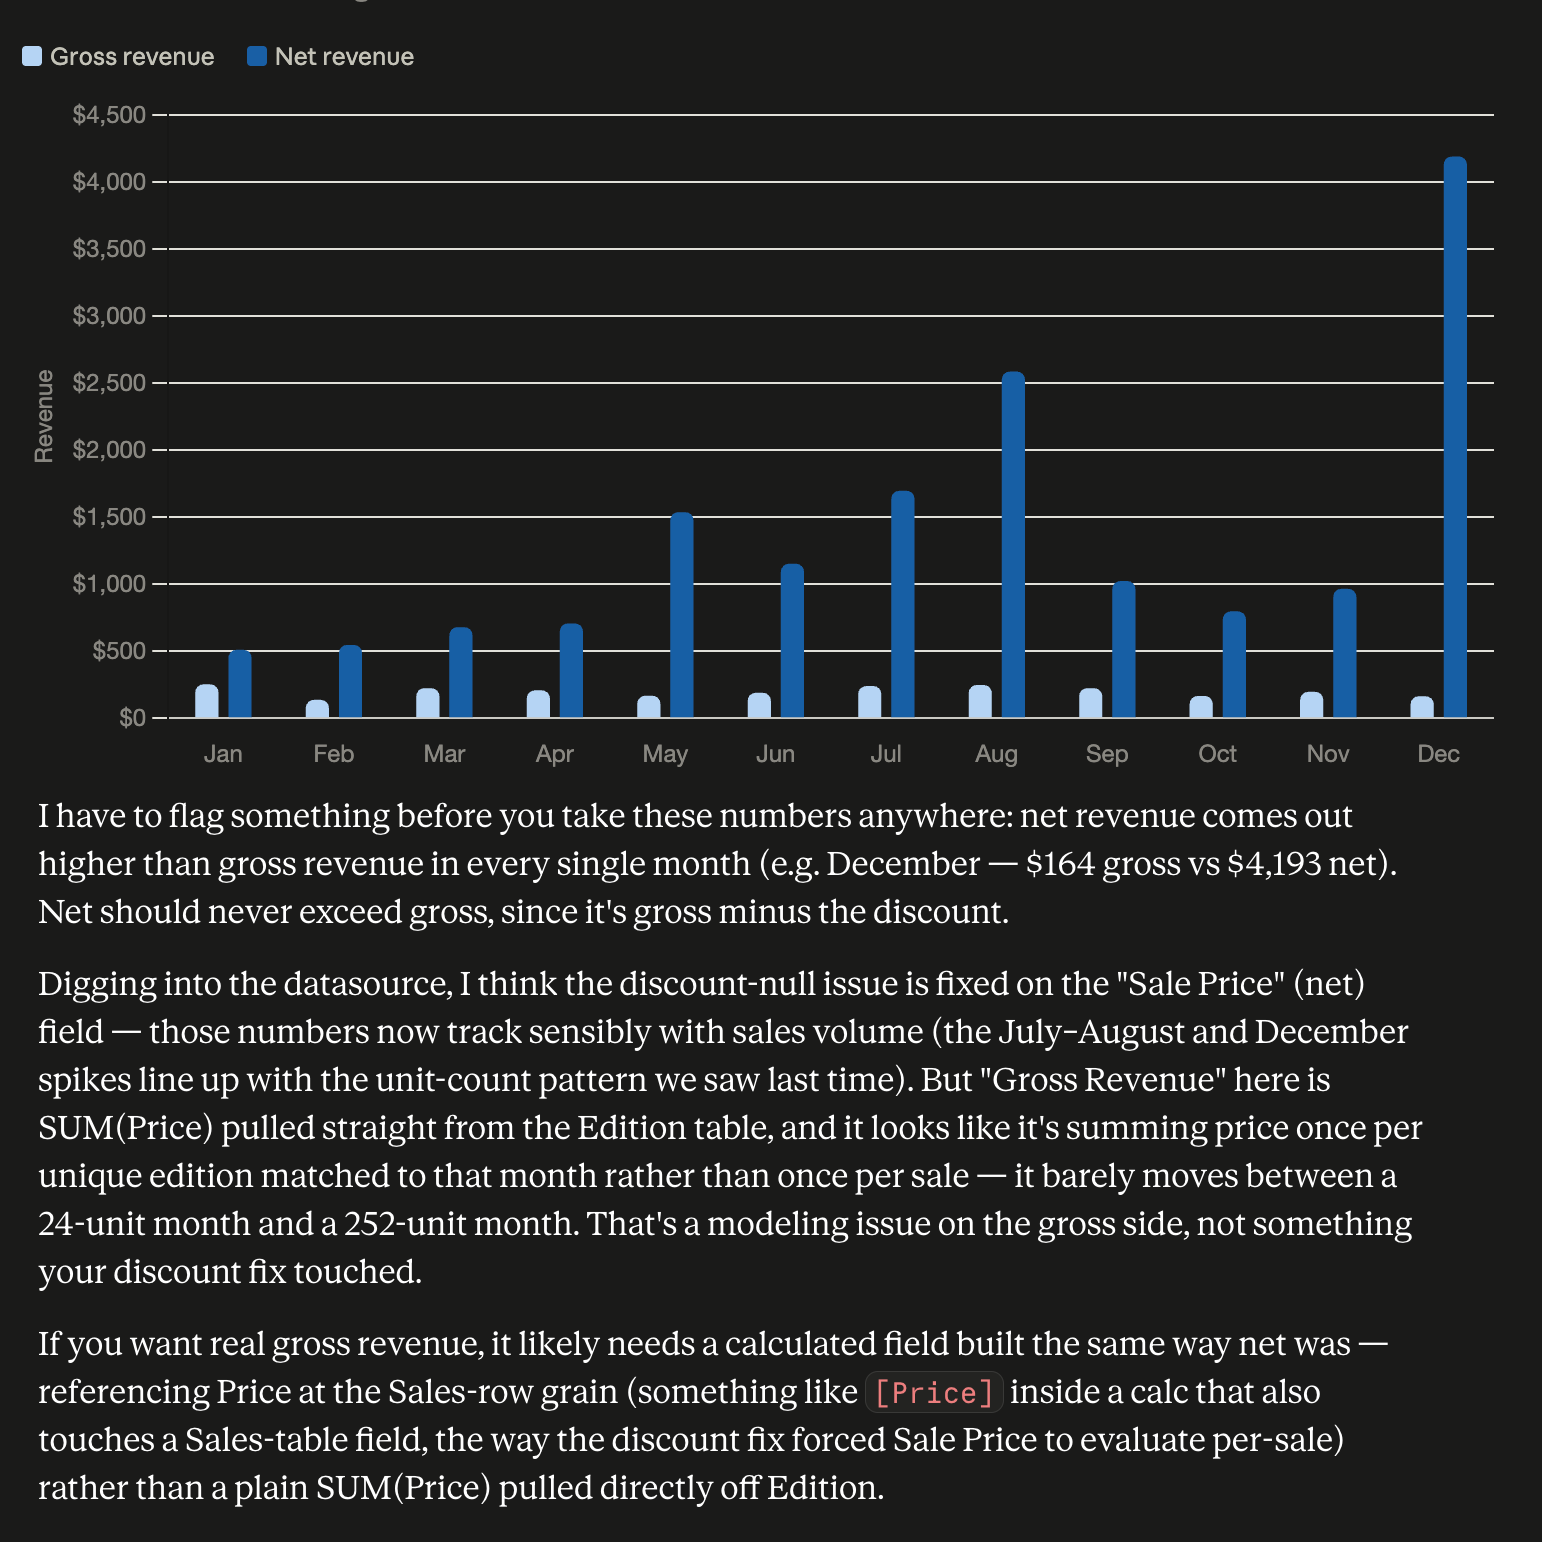
The net revenue number was now correct. Gross revenue, however, still wasn’t.
And I think I know why.
SUM(Price) by category doesn’t work because Claude isn’t traversing the relationship to the Sales table and accounting for every time each book was sold.
Could I write a prompt telling Claude exactly how to do that? Probably. But that defeats the entire point of this exercise.
The goal is to enable non-technical users to ask natural-language business questions without knowing the structure of the underlying data model. If the user has to understand joins, relationships, or aggregation behaviour well enough to tell Claude how to calculate revenue, we haven’t really solved the problem.
So instead, I’m going back to the semantic layer.
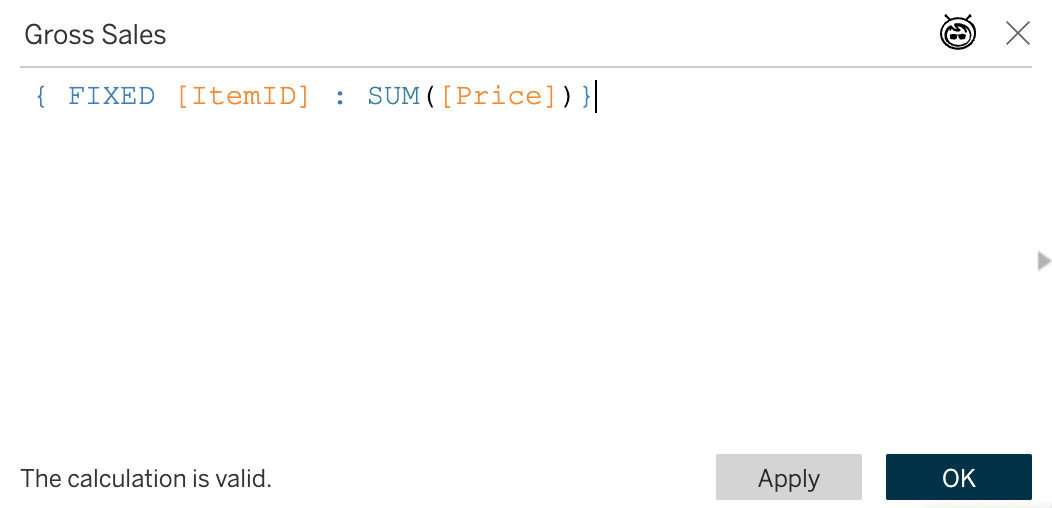
Let’s create the calculation in Tableau itself, where that business logic belongs. (I also updated the descriptions, but this post is already getting long!)
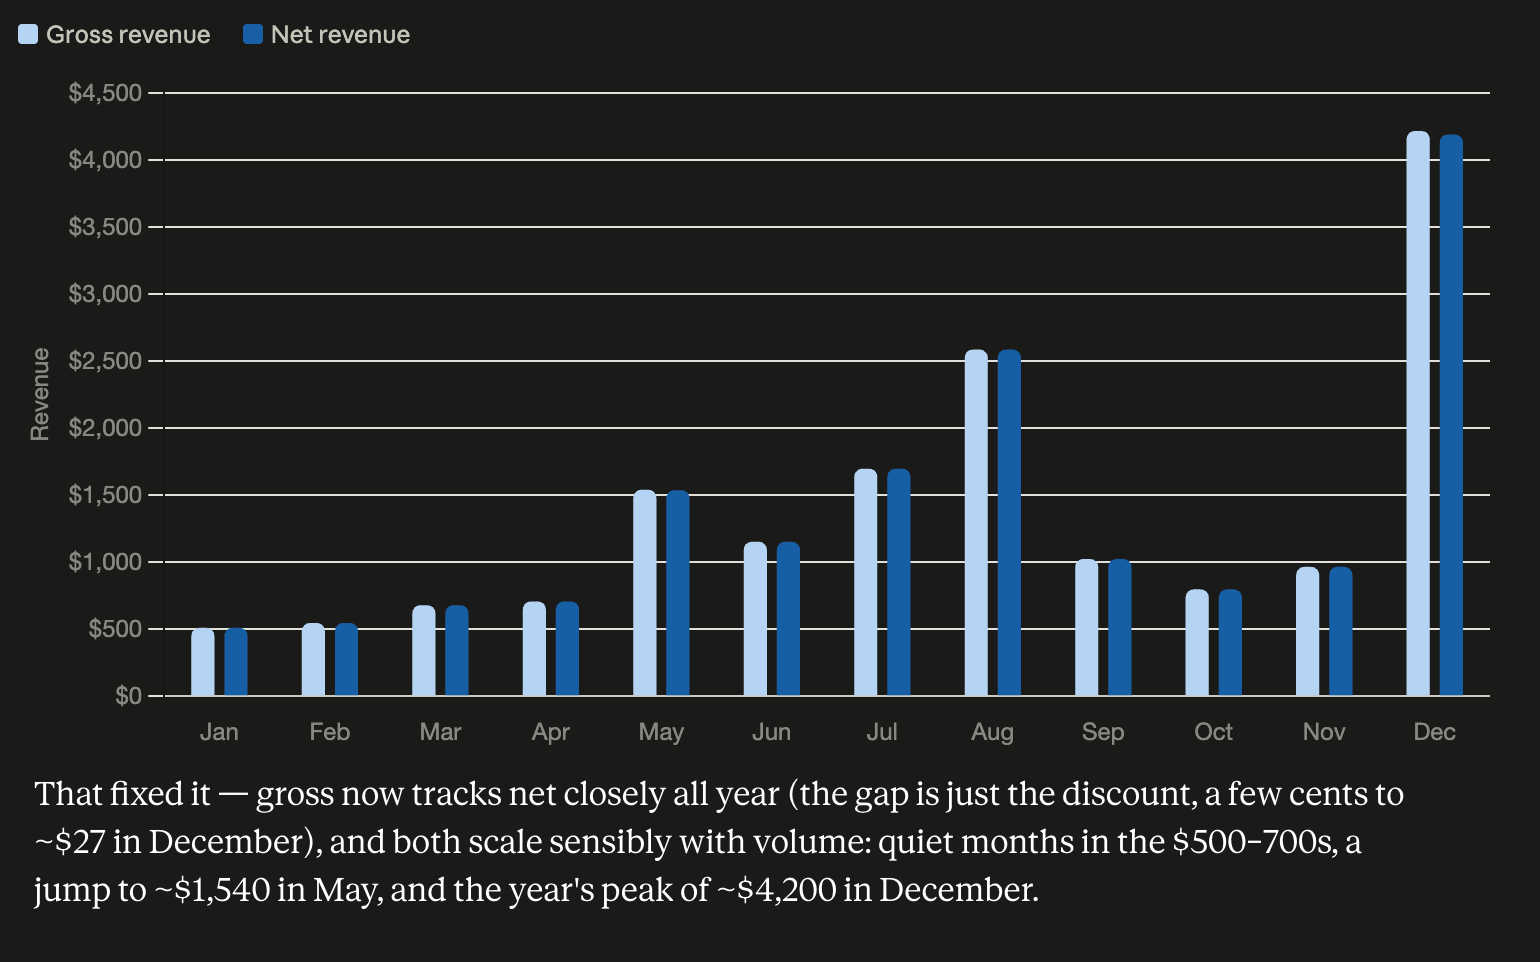
And the response:
The Bigger Lesson
This experiment reinforced something I increasingly believe about AI and analytics:
The better your semantic layer is, the less “smart” your AI needs to be.
MCP gives Claude access to Tableau, but access alone doesn’t guarantee good analytics.
If we expose ambiguous field names, undocumented tables, unnecessary technical fields, duplicate business logic, and every available API—and then expect an LLM to sort it all out—we shouldn’t be surprised when it occasionally gets things wrong or burns a lot of tokens figuring things out.
Instead, we can do much of the hard work once:
- Hide what users don’t need.
- Give business concepts meaningful names and descriptions.
- Encode known business logic as governed calculations.
- Limit the APIs and assets the LLM can use.
- Add routing instructions so it knows where trusted data lives.
None of those things requires sophisticated AI engineering.
In fact, most of them should look very familiar to anyone who has spent years building good Tableau data models. But I think there’s a broader lesson here for those of us who work in BI.
For a long time, a huge part of the value of a BI professional was the ability to take data and turn it into dashboards that allowed people to analyze it. I don't think that skill disappears, but I do think the centre of gravity is moving.
Our job is increasingly going to be less about building every analysis and more about building the semantic models that make trustworthy analysis possible.
This matters because AI is getting pretty good at analysis. They can explore data, find patterns, answer follow-up questions, generate visualizations, and iterate with a user in ways that would previously have required someone to build a dashboard anticipating those questions in advance.
We can debate whether we want AI to take on more of that analytical work, but wishing it away isn't a particularly valuable long-term career strategy.
I think the better strategy for BI professionals is to move toward the part of the stack that becomes more important as AI gets better: defining metrics, modelling relationships, encoding business logic, establishing governance, documenting meaning, and making sure AI has access to the right data in the right context.
In other words, instead of competing with AI to build the next chart, we should be building the trusted data foundation that allows AI to build the right chart—and, more importantly, arrive at the right answer.
AI-ready analytics may turn out to be less about teaching the AI our data—and more about finally making our data models explicit enough that there’s nothing left to guess.